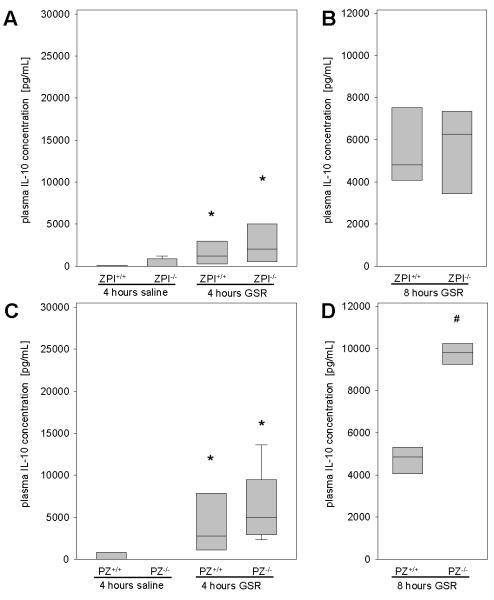
Figure 6. Analysis of IL-10 plasma concentrations.
IL-10 concentrations are quantified for ZPI (A, B) or PZ (C, D) mouse strains 4 (A, C) as well as 8 hours (B, D) after induction of GSR or exposure to physiological saline. Data are given as box plots indicating the median with the 25th and 75th percentiles. Mann-Whitney rank-sum test, followed by Bonferroni correction; * p<0.05 vs. saline-treated mice with the same genetic background, # p<0.05 vs. wild-type GSR mice. Abbreviations: PZ, protein Z; ZPI, protein Z-dependent protease-inhibitor; GSR, generalized Shwartzman reaction; IL-10, interleukin-10. (GSR 4 hours: ZPI+/+ n=11, ZPI−/− n=14, PZ+/+ n=11, PZ−/− n=14; saline: ZPI+/+ n=11, ZPI−/− n=13, PZ+/+ n=12, PZ−/− n=12; GSR 8 hours: ZPI+/+ n=5, ZPI−/− n=6, PZ+/+ n=4, PZ−/− n=8).

