
Figure 2.
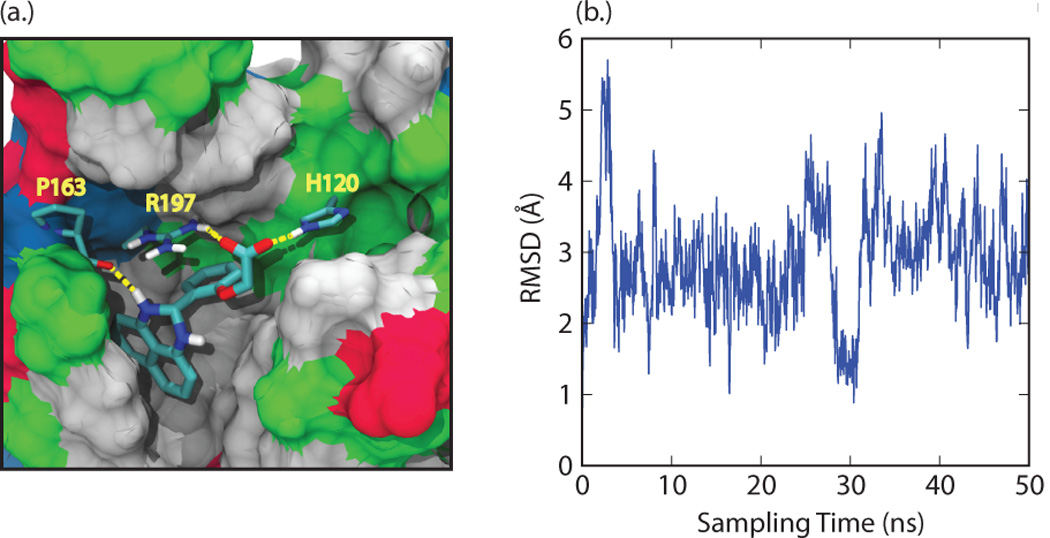
(a) Docking pose for compound 1 generated in "induced fit docking" calculations. Residues H120, P163, and R197 from SrtA are explicitly represented, along with their intermolecular hydrogen bonds to the small molecule (yellow lines). The remainder of SrtA is shown by a surface representation, with non-polar residues in grey, polar residues in green, acidic residues in red, and basic residues in blue. (b) Root-mean squared deviation (RMSD) of the position of the compound relative to its initial binding pose in SrtA at various time points during the 50 ns molecular dynamics simulation.