
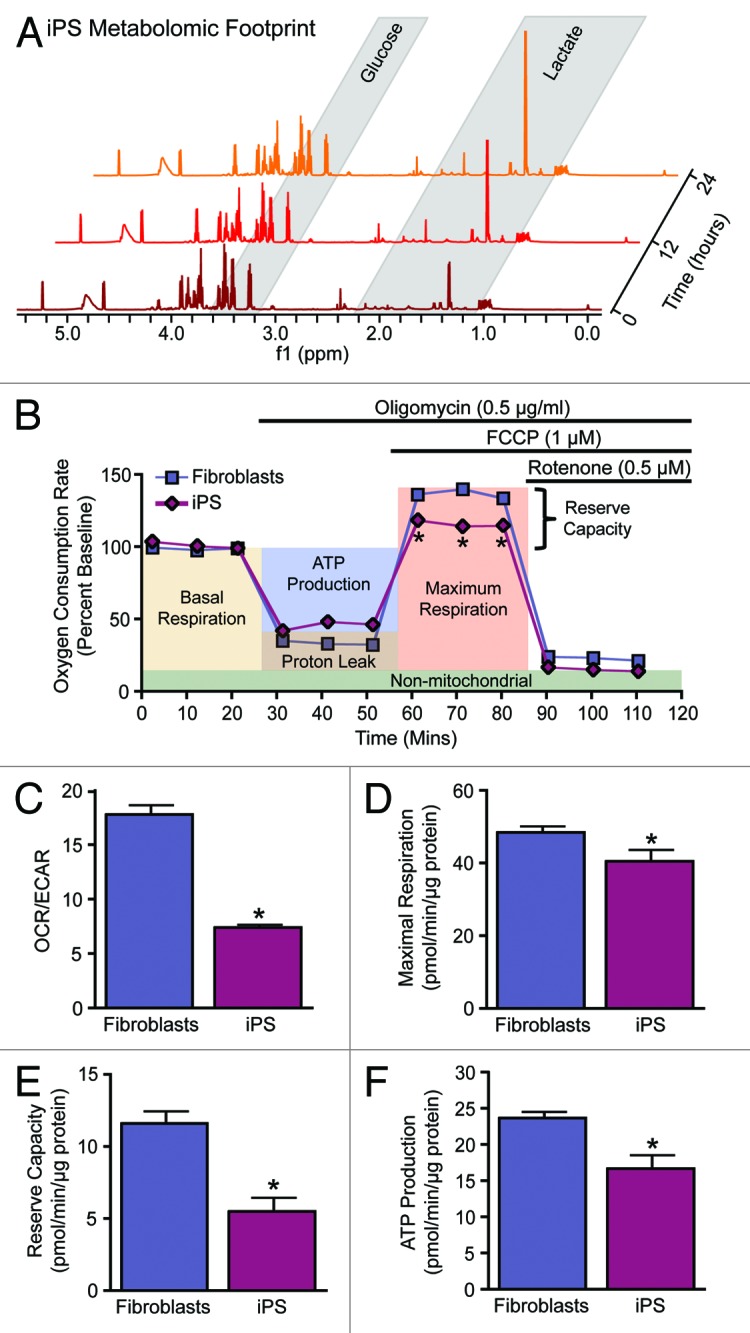
Figure 1. Metabolic reprogramming from oxidative metabolism in fibroblasts to glycolysis in iPS cells. Representative serial nuclear magnetic resonance-based metabolomic footprinting of cell culture media indicates elevated glucose utilization and accumulation of lactate in iPS cells (A). High-throughput simultaneous measurement of oxygen consumption rate (OCR) and extracellular acidification rate (ECAR) (B) indicates reduced oxygen utilization and greater reliance on glycolysis in iPS cells (C). Extracellular flux analysis in response to oligomycin, FCCP, and rotenone demonstrates an iPS cell specific mitochondrial profile characterized by reduced maximal respiration (D), reserve capacity (E) and ATP turnover (F). Values represent mean ± standard error, n = 8 per group. Significance was determined by Student t test. *P < 0.05 vs. MEF.