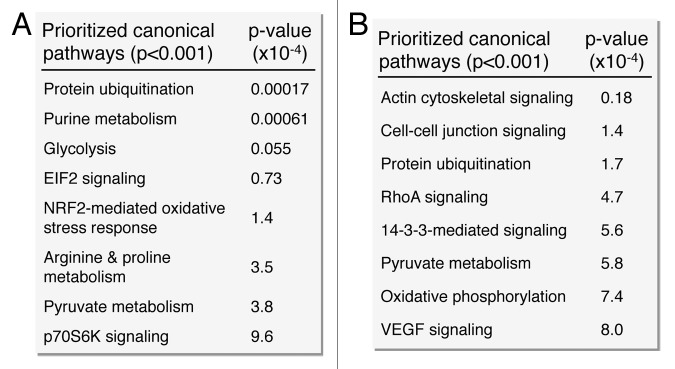
Figure 6. Pathway analysis interaction mapping prioritizes canonical metabolic processes within the upregulated and downregulated iPS subproteomes. Ingenuity Pathway Analysis identified a number of overrepresented (P < 0.001) metabolic canonical pathways within the upregulated (A) and downregulated proteins arising from somatic cell reprogramming (B).
