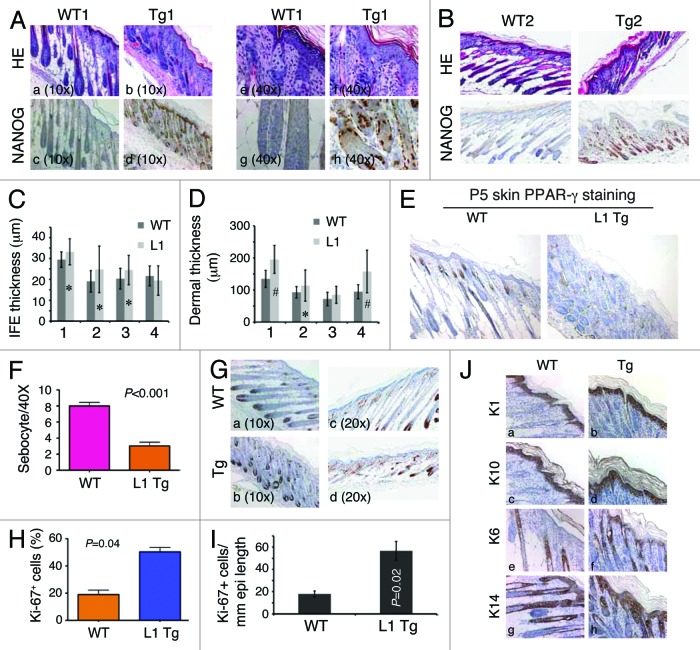
Figure 2. Skin phenotypes in P5 L1 Tg animals. (Aand B) H and E and Nanog IHC analysis in the skin of two P5 WT and L1 Tg animals. Nanog immunostaining was performed using anti-human Nanog Ab (R&D; Table S1). For (A), representative low (A–D; objective 10×) and high (E–H; objective 40×) magnification images are shown. For (B), all original magnifications were 200×. (C) Quantification of IFE thickness. Four pairs of P5 WT and L1 K14-NanogP8 animals (indicated on the x-axis) were subjected to IFE thickness quantification in which 25 randomly selected areas (in each animal) of IFE perpendicular to the basement membrane were measured by Aperio ScanScope. Shown are the mean ± SD *P < 0.05 (Student t test). (D) Quantification of dermal thickness. The same 4 pairs of P5 WT and L1 K14-NanogP8 animals were subjected to dermal thickness quantification in which 25 randomly selected positions (in each animal) of dermis through to the muscle layer (excluding the hypodermis) were measured by Aperio ScanScope. Shown are the mean ± SD #P < 0.001; *P = 0.05 (Student t test). (E and F) The P5 L1 Tg skin shows reduced sebocytes. Shown in (E) are PPARγ stained images (200×) and in (F) quantification of sebocytes. (G–I) The P5 L1 Tg IFE showed increased proliferation. Shown in (G) are representative images of Ki-67 immunostaining in pair 1 (left) and pair 2 (right) of WT and L1 Tg epidermis. Shown in (H) is the quantification of Ki-67+ cells (a total of 500 cells counted for each in pair 1). For (I), the total Ki-67+ nuclei were quantified using the Aperio nuclear analysis algorithm over a 3 mm epidermal length. P value is indicated. (J) Cytokeratin staining in the P5 WT and Tg skin. Note prominent hyperkeratosis in the Tg skin. Original magnifications, ×200.

An official website of the United States government
Here's how you know
Official websites use .gov
A
.gov website belongs to an official
government organization in the United States.
Secure .gov websites use HTTPS
A lock (
) or https:// means you've safely
connected to the .gov website. Share sensitive
information only on official, secure websites.
