
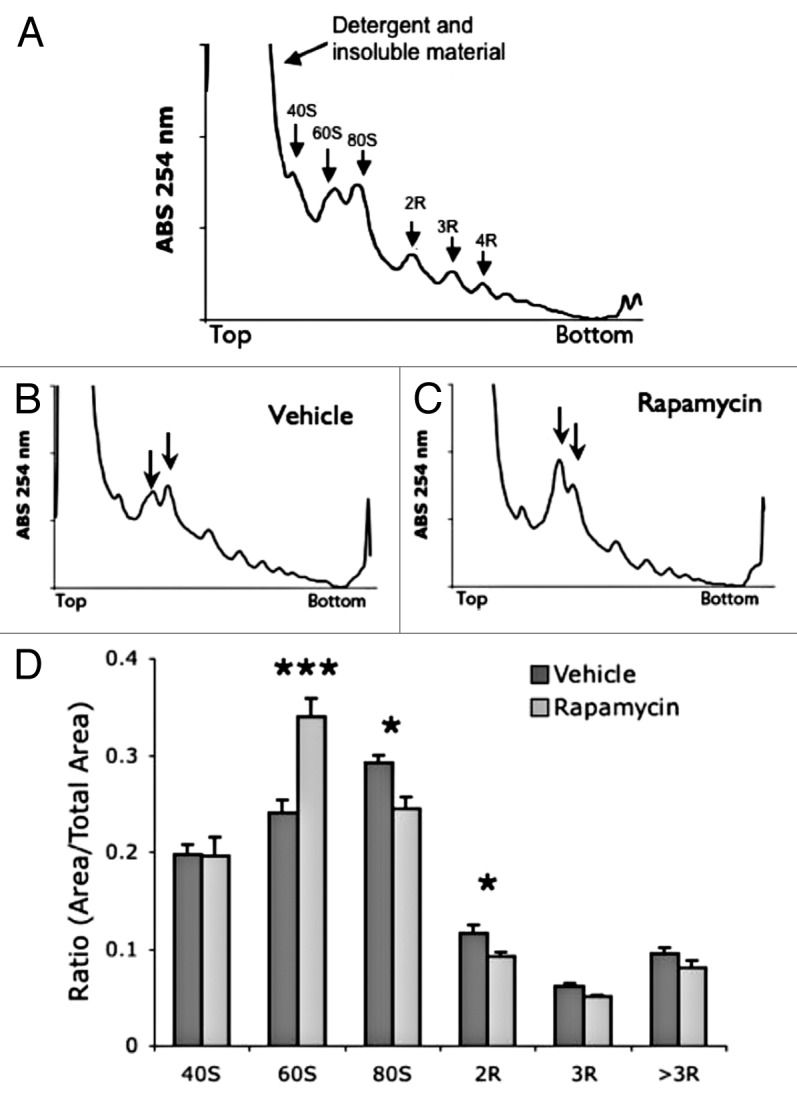
Figure 2. Acute treatment with rapamycin alters polysome profile in mouse muscle tissue. (A) Example muscle polysome profile. (B and C) representative muscle polysome profiles from vehicle (B) and rapamycin (C) treated mice. Arrows indicate 60S and 80S peaks. (D) Quantification of polysome peaks from vehicle and rapamycin-treated liver tissue. ***P < 0.001; *P < 0.05; 2-way ANOVA, Bonferroni post hoc test. For both groups, n = 6.