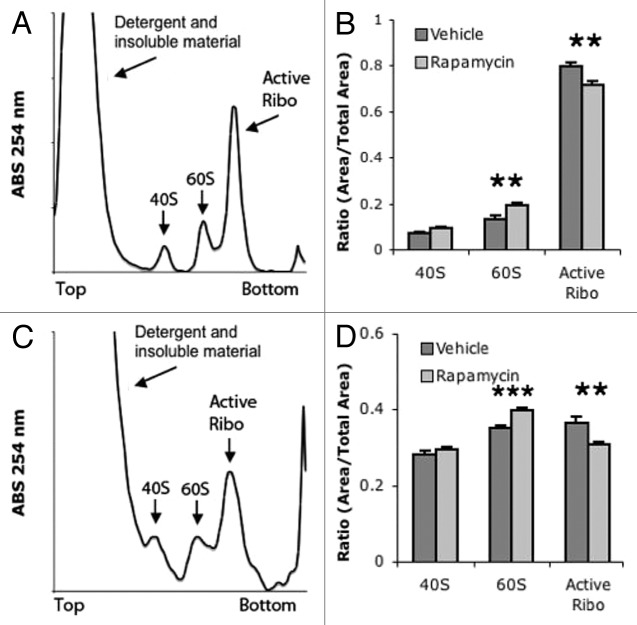
Figure 3. ARA demonstrates that acute rapamycin reduces ribosome activity. (A) Example liver ARA profile. Unlike polysome gradients, active ribosomes are combined into a single peak. (B) Quantification of liver ARA from vehicle and rapamycin-treated mice. (C) Example muscle ARA profile. (D) Quantification of muscle ARA from vehicle and rapamycin-treated mice. ***P < 0.001; **P < 0.05; 2-way ANOVA, Bonferroni post hoc test. For all groups, n = 6.

An official website of the United States government
Here's how you know
Official websites use .gov
A
.gov website belongs to an official
government organization in the United States.
Secure .gov websites use HTTPS
A lock (
) or https:// means you've safely
connected to the .gov website. Share sensitive
information only on official, secure websites.
