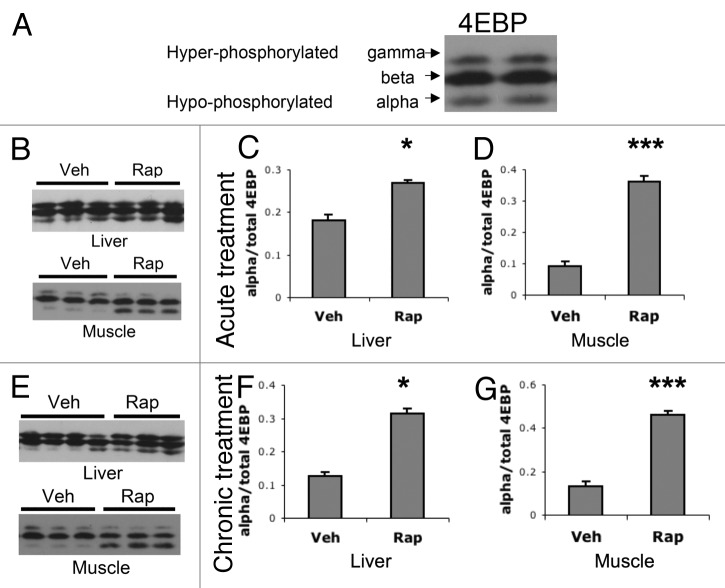
Figure 7. Acute and chronic rapamycin treatments increase levels of hypo-phosphorylated 4EBP. (A) western blots of 4EBP show 3 bands, hyperphosphorylated high weight (gamma) and middle (beta) bands, and a lower weight hypo-phosphorylated (alpha) band. (B–D) Western blot analysis of liver and muscle following acute treatment with vehicle or rapamycin. (B) Representative western blots of liver and muscle tissues following acute vehicle (Veh) or rapamycin (Rap) treatment. (C) Quantification of the ratio of hypo-phosphorylated alpha band of 4EBP over the total 4EBP bands in liver tissue. (D) Quantification of the ratio of alpha to total 4EBP bands in muscle tissue. (E–G) western blot analysis of liver and muscle following chronic treatment with vehicle or rapamycin. (E) Representative western blots of liver and muscle tissues following chronic vehicle or rapamycin treatment. (F) Quantification of the ratio of alpha to total 4EBP bands in liver tissue following chronic treatments. (G) Quantification of the ratio of alpha to total 4EBP bands in liver tissue following chronic treatments. T-test was used to compare Veh to Rap: *P < 0.05; **P < 0.01; ***P < 0.001. For all acute treated groups, n = 8. For all chronic vehicle groups, n = 8. For chronic rapamycin groups, n = 6.

An official website of the United States government
Here's how you know
Official websites use .gov
A
.gov website belongs to an official
government organization in the United States.
Secure .gov websites use HTTPS
A lock (
) or https:// means you've safely
connected to the .gov website. Share sensitive
information only on official, secure websites.
