
Fig. 1.
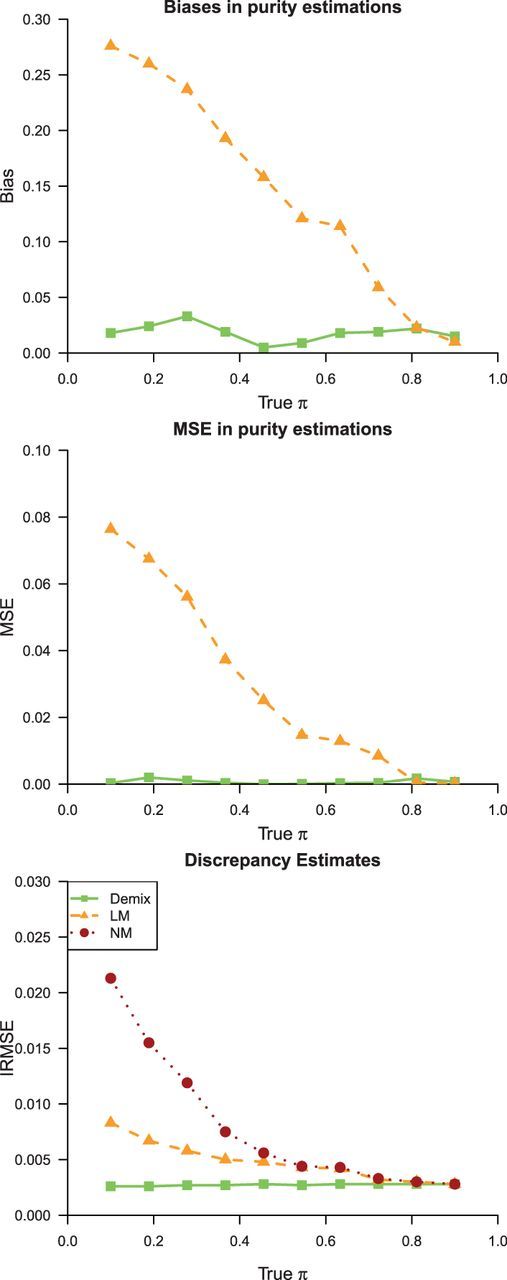
Simulation results for data scenario 1. Shown are estimates of biases, MSEs and IRMSEs based on the DeMix and LM, for mixed samples at assigned B-type tissue proportions ( ) varying from 0.1 to 0.9. For IRMSE, we also present results from the NM model