
Fig. 3.
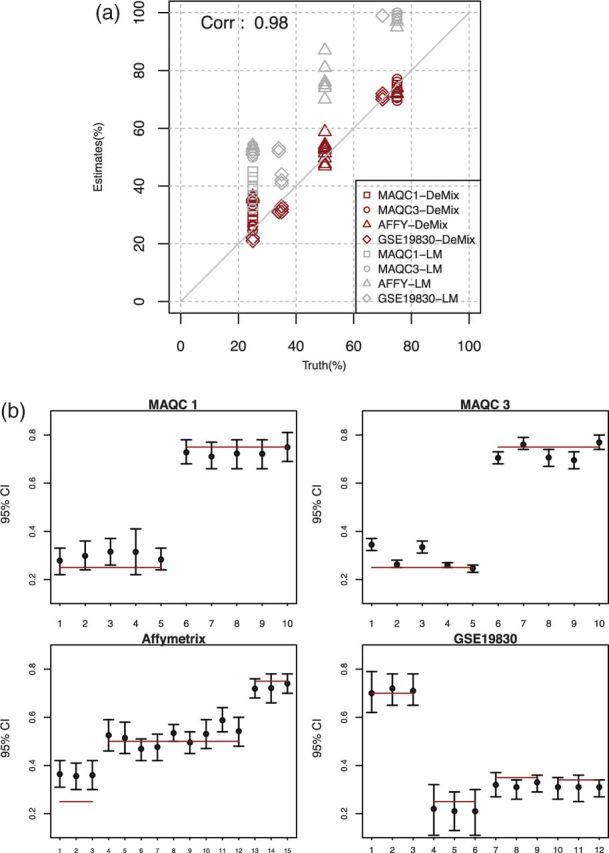
Estimation of proportions of hidden tissues from four available data sources. MAQC1: MAQC site 1, MAQC3: MAQC site 3, AFFY:Affymetrix, and GSE19830. (a) Estimated tissue proportions versus true proportions; black represents the DeMix estimates; gray represents LM estimates. (b) Estimated 95% confidence intervals of  's; solid lines correspond to true π's