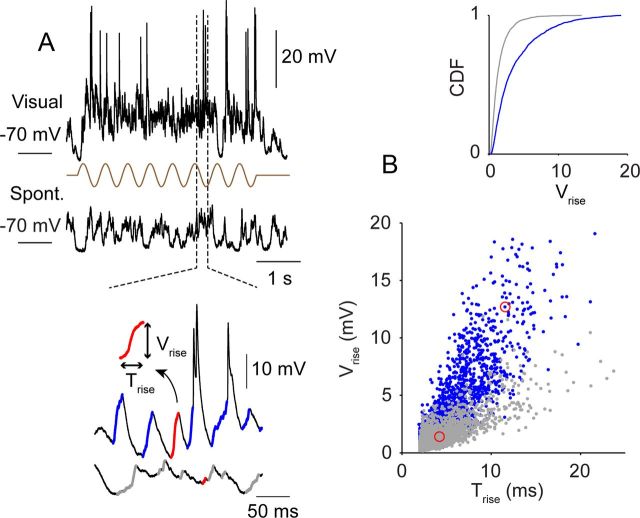
Figure 1.
High-frequency components in visually evoked Vm fluctuations. A, Top, Visually evoked and spontaneous (Spont.) Vm fluctuations of an example layer 2/3 complex cell. Bottom, Voltage excursions are identified and labeled for evoked (blue) and spontaneous (gray) Vm fluctuations. The definition of time to peak (Trise) and amplitude (Vrise) of the depolarizing transients is illustrated in the inset. B, Distribution of Trise and Vrise for spontaneous (gray) and visually evoked (blue) activities of the example cell. Red circles mark examples that are highlighted in A. The inset is the cumulative distribution functions (CDF) of Vrise.

