
Figure 2.
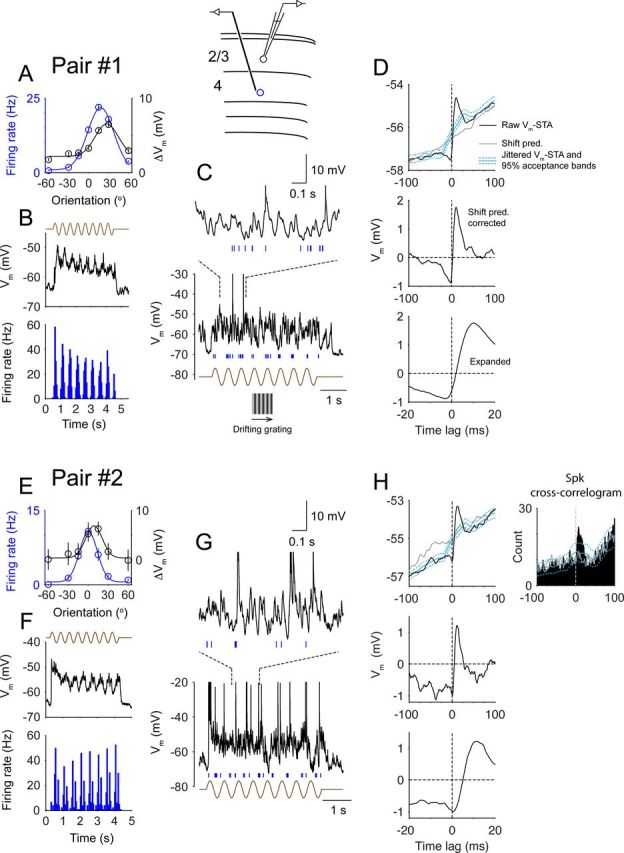
Functional coupling between simple and complex cells in visual responses. The diagram shows an extracellular unit (blue) recorded with a microelectrode in layer 4 and a layer 2/3 cell (black) recorded in the whole-cell configuration. A, Orientation tunings of the simple cell's spikes (blue, F1 components) and the complex cell's mean depolarization (black). Error bars denote SEM. B, Average Vm of the complex cell and the PSTH of the simple cell during visual stimulation (30°). The brown trace depicts the time course of the drifting grating. C, A single trial of visual responses of two cells (black trace, Vm of the complex cell; blue tick marks, spike times of the simple cell). A 1 s segment is expanded at the top. D, Top, Raw Vm-STA (black) and the shift predictor (gray, Shift pred.) derived from visual responses. Cyan lines are mean jittered Vm-STAs and 95% acceptance bands. Middle, Vm-STA with shift predictor subtracted. Bottom, Expanded plot around the zero-lag. E–H, Same as A–D for pair #2. Top right, Spike cross-correlogram (bin size, 1 ms) displaying a highly asymmetrical shape and a significant peak at 7 ms. Gray line, Shift predictor; cyan lines, mean jittered spike cross-correlogram and 95% acceptance bands. Spk, Spike.