
Figure 3.
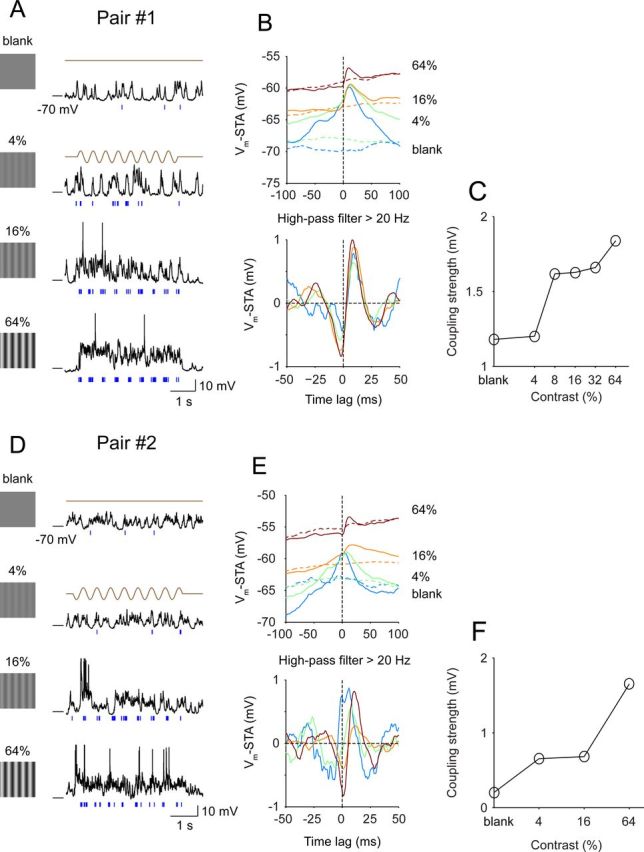
Coupling as a function of stimulus contrast. Shown here are the contrast dependence of visual responses and couplings of pairs #1 and #2. A, Responses of the complex cell (Vm, black) and the simple cell (spike, blue) to different stimulus contrasts (0%, 4%, 16%, and 64%). B, Top, Raw Vm-STAs (solid lines) and the shift predictors (dashed lines) under different stimulus conditions. Bottom, Shift predictor-corrected Vm-STAs were high-pass filtered for a comparison of the fast coupling around zero-lag. C, Coupling as a function of contrast. The coupling strength is derived from filtered Vm-STAs and is calculated as the difference between the trough before the zero-lag and the peak. D–F, Similar to A–C for pair #2. The coupling strength is the difference between the trough after the zero-lag and the peak.