Figure 9.
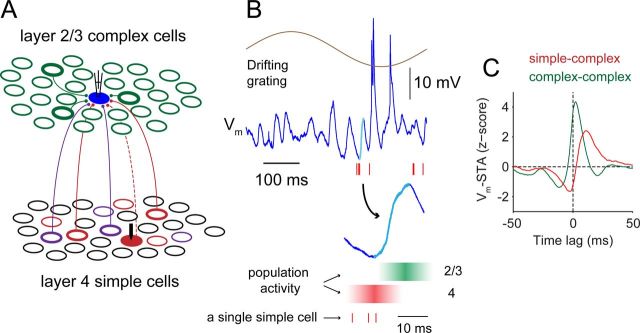
A circuit diagram for population dynamics in L4 to L2/3 circuits. A, Cortical circuit diagram. Layer 2/3 complex cells show widespread synchronous Vm fluctuations and only a small percentage (bold) of the nearby cells connect to the recorded cell (filled blue circle). In layer 4, simple cells are grouped functionally into different subsets (e.g., red and purple) based on their spatial-phase selectivity. Within each subset, only a small percentage of cells (bold) synaptically connect to the recorded layer 2/3 cell. A recorded simple cell (filled red circle) is shown with its possible connection to the recorded layer 2/3 cell (dashed line). This pair of recorded cells is pair #2 in Figure 2. B, Vm activity of the recorded layer 2/3 cell during visual stimulation (blue). The corresponding drifting grating is shown (brown). Red tick marks are spikes of the recorded simple cell in the pair. A depolarizing transient (13 mV, 12 ms) is highlighted in cyan and expanded. Hypothetical local population activity is illustrated with reference to the Vm depolarization. An increase of layer 4 population activity (red) occurs around the onset of the transient. The recorded simple cell (red tick marks) belongs to the population. Activity of layer 2/3 complex cells (green) grows toward the peak of the transient. C, Different waveforms of couplings in simple–complex pairs (red, 12 pairs) and complex–complex pairs (green, 4 pairs).

