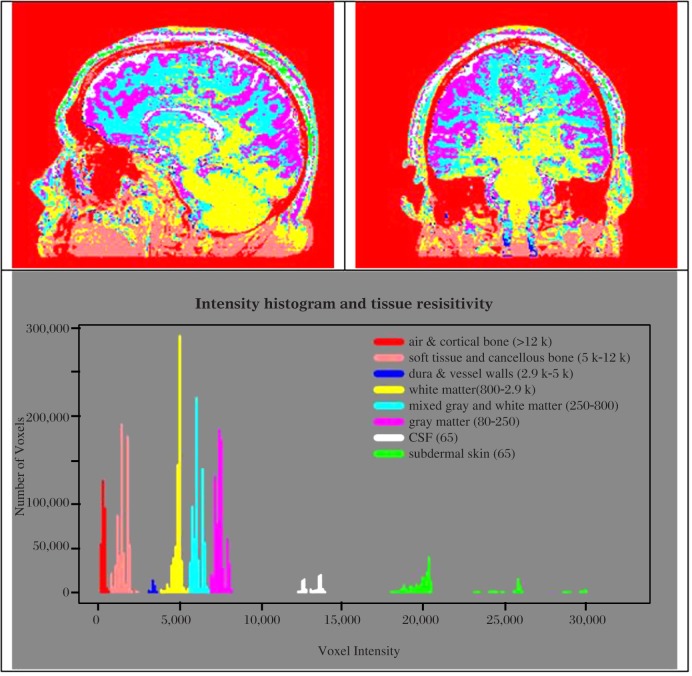
Fig. 5. Color coded images of the various tissues and histogram of the number of voxels at each range of combined MRI intensity converted to color maps of resistivity.
Note that the resistivities overlap different types of tissues and vary somewhat within tissues. The colors represent the tissues in a range of resistive values in Ohms per centimeter.

