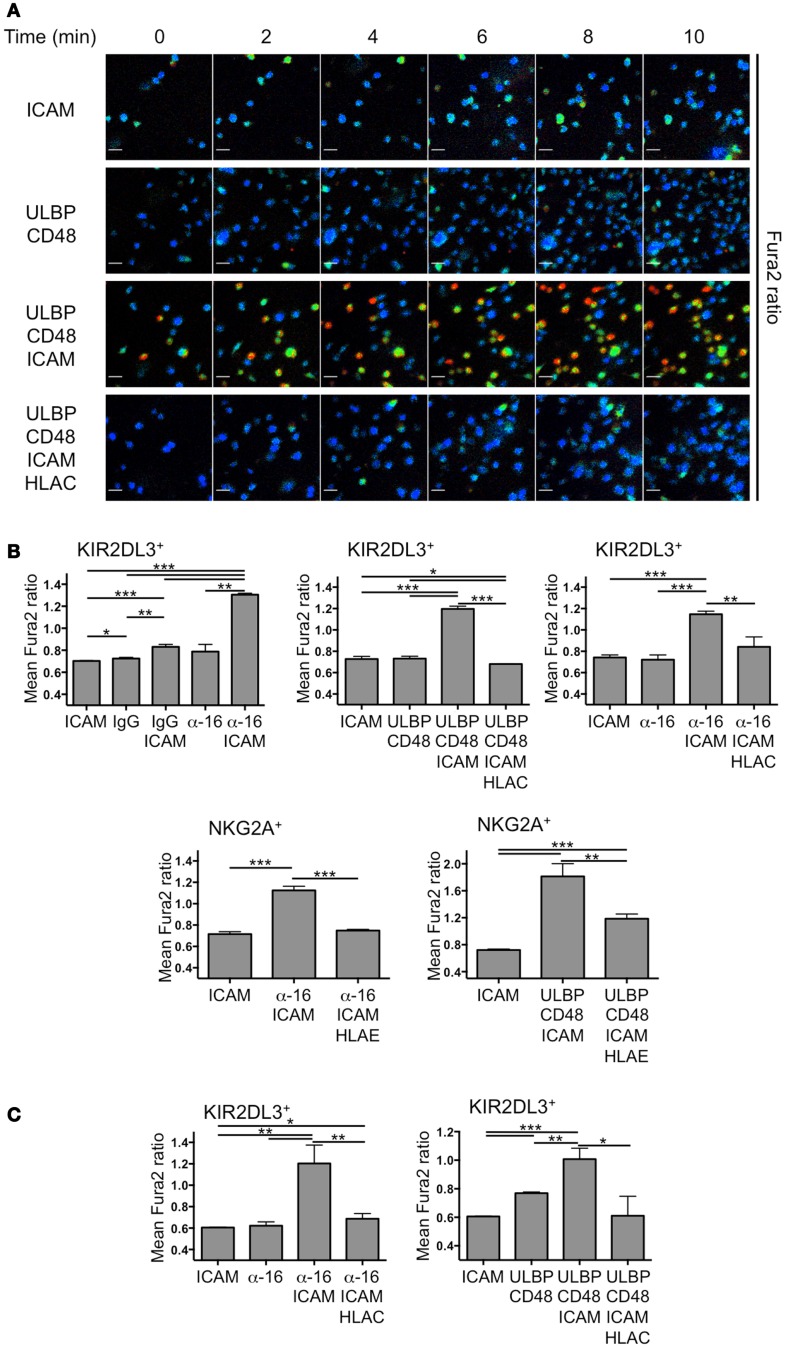
Figure 1.
Primary NK cell activation on stimulatory lipid bilayers. IL-2-cultured and resting primary human NK cells were sorted into KIR2DL3+ or NKG2A+ populations, loaded with Fura2-AM and imaged on supported lipid bilayers. (A) Time-lapse montages from a representative experiment showing single cell Ca2+ responses from KIR2DL3+ cells on bilayers containing the indicated activating and inhibitory NK receptor ligands. Fura2 ratio is pseudocolored with cooler and warmer colors indicating low and high intracellular Ca2+ concentration, respectively. (B,C) Ca2+ influx was quantified for IL-2-cultured (B) or resting (C) KIR2DL3+ or NKG2A+ cells as indicated by calculating the average Fura-2 ratio for all cells in the imaging field during the plateau phase of the global response (see Materials and Methods). Error bars denote standard error of the mean (SEM). P-values were calculated using Student’s t-test, with ***P < 0.001, **P < 0.01, and *P ≤ 0.05. HLAC = HLA-Cw3; HLA-E = HLA-E; ULBP = ULBP3; α-16 = anti-CD16.

