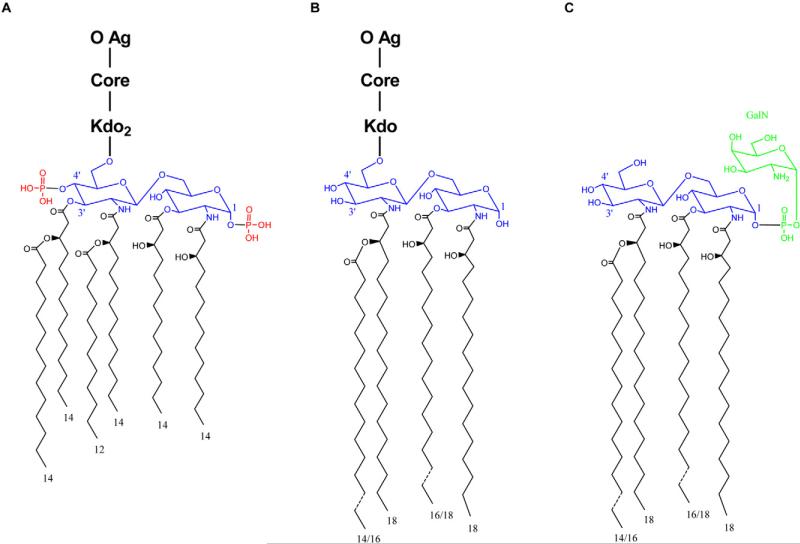
Fig. 1.
E. coli and Francisella LPS and lipid A structures. Structures of (A) E. coli LPS, (B) complete LPS from Francisella species and (C) ‘free’ lipid A of Francisella species are compared. (A, B) O-antigen (O Ag), core sugars (Core) and the specific core sugar Kdo (Kdo) are indicated. For all structures, lipid A backbone disaccharides are highlighted in blue and acyl chains are represented in black with numbers denoting length. E. coli lipid A 4′ and 1 position phosphate groups (missing from the lipid A of complete Francisella LPS) are highlighted in red. Unlike the lipid A component of complete Francisella LPS, Francisella free lipid A includes a phosphate modified with galactosamine at the 1 position (highlighted in green).

