
Figure 3.
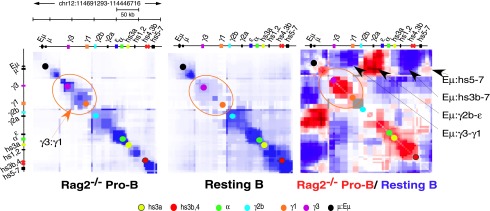
A developmentally stage-specific chromatin configuration of the Igh locus. 5C analyses of the Igh locus in Rag 2−/− pro-B cells and resting splenic B cells are represented in heat maps of 5C data (bin size 30 kb; step size 3.0 kb). Interaction frequencies are plotted against genomic distance. Blue intensity represents the contact frequency between genomic coordinates. The diagonal represents frequent proximal intrachromosomal interactions along the linear Igh locus. 5C signals off the diagonal indicate looping interactions. (Right panel) Log2 ratio of pro-B/resting B 5C interactions where pro-B (red) and resting B (blue) contact.