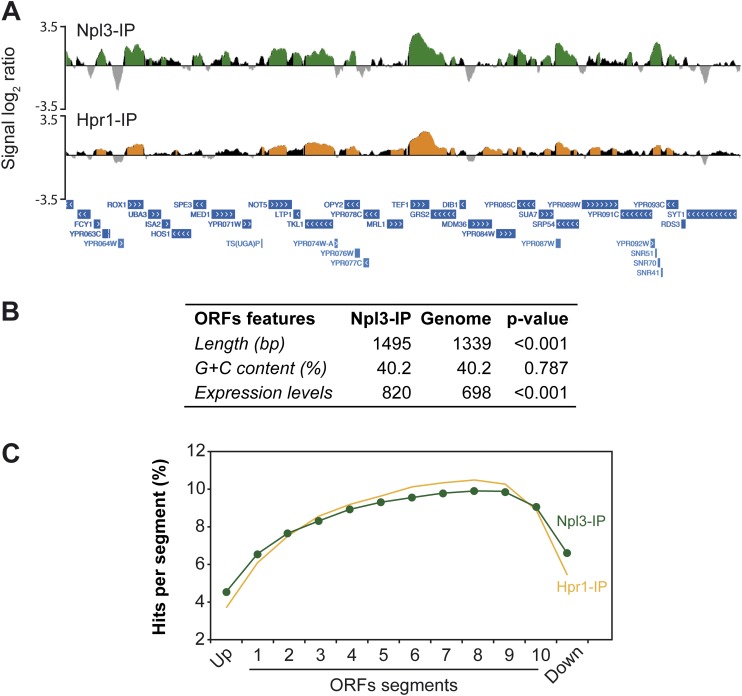
Figure 6.
Npl3 and Hpr1 recruitment to highly transcribed ORFs. (A) Genomic view of Npl3-MYC (YAM535) and Hpr1-Flag (SYHPR1) recruitment. A fragment of chromosome XVI is plotted with the signal log2 ratio values. Green (Npl3-IP) and orange (Hpr1-IP) histograms represent the significant clusters. SGD features are represented below as blue bars with white arrows according to the direction of transcription. (B) Table showing the statistical analysis of length, G+C content, and expression levels of the genes mapped by Npl3 clusters. P-value was calculated by Mann-Whitney's U-test. (C) Composite profile of Npl3 and Hpr1 occupancy detected by ChIP–chip across the average ORF plotted as Npl3 or Hpr1 percentage of ChIP clusters per segment.

