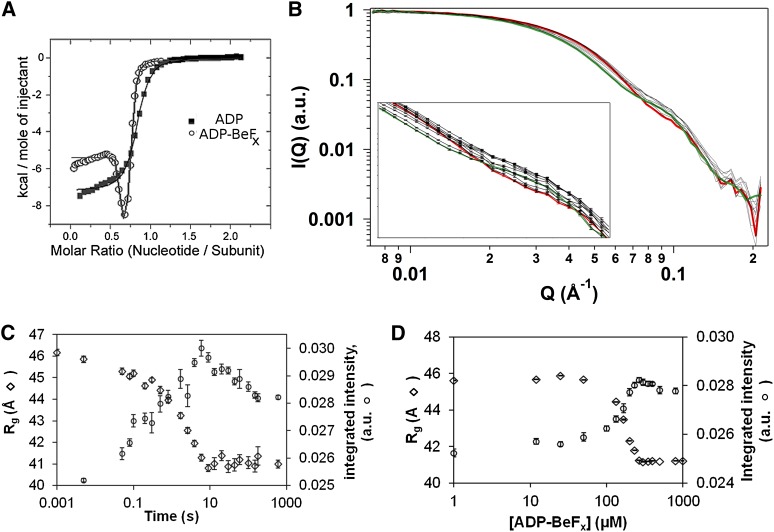
Figure 1.
Nucleotide binding to NtrC1 ATPase and its X-ray-scattering response. (A) ITC measurements for NtrC1 titrated with ADP (closed squares) and ADP-BeFx (open circles). (Solid lines) Fits to models with one or two binding sites, respectively (parameters are in Supplemental Table S1). (B) Time-resolved scattering profiles of NtrC1 after mixing with 1 mM ADP-BeFx. For clarity of presentation, only every third profile from 5 msec to 3 min is shown; errors are illustrated only in the inset. (Green) Profile for apo NtrC1; (red) profile for protein pre-equilibrated with nucleotide. (C) Scattering intensity integrated over the Q-vector range of 0.01 to 0.12 Å−1 (right axis; open circles) or radius of gyration (left axis; open rhombs) versus time after mixing NtrC1 with ADP-BeFx (final concentrations 327 μM and 1 mM, respectively). (D) Same as C, but for NtrC1 equilibrated with the indicated concentrations of ADP-BeFx before exposure to X-rays.

