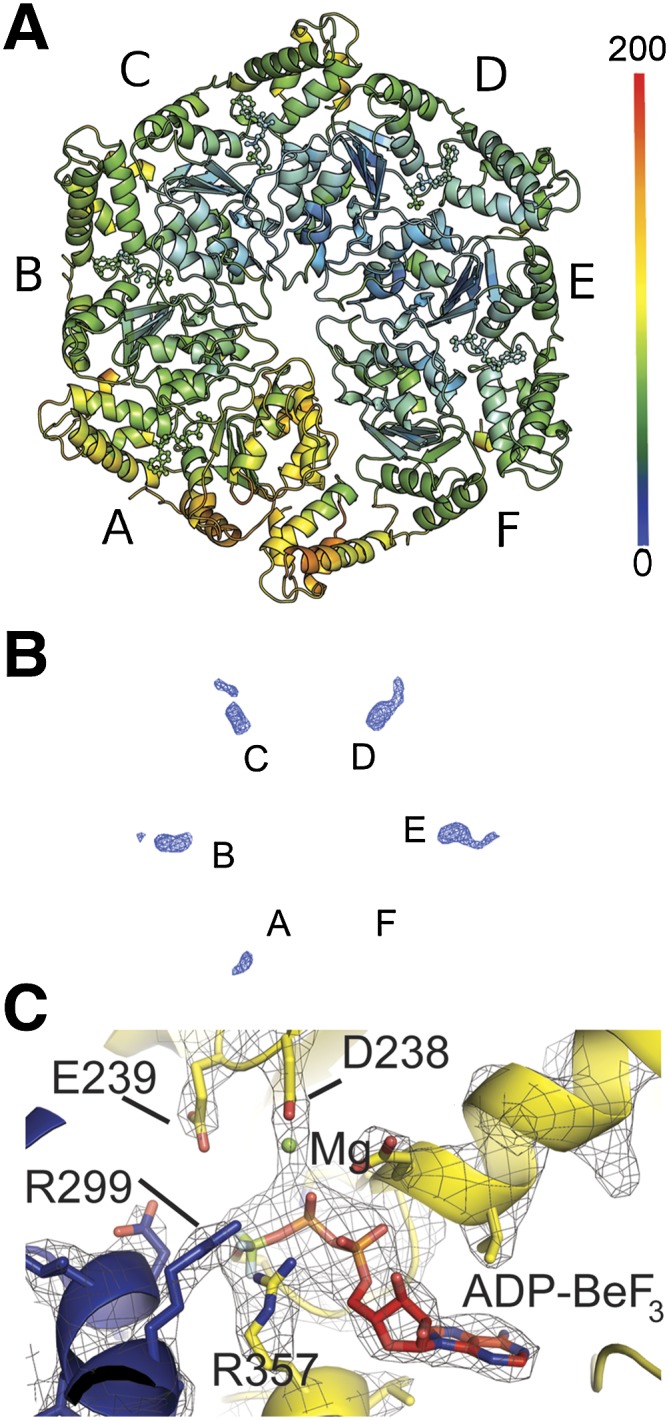
Figure 3.

Asymmetry of the NtrC1 hexamer. (A) NtrC1 hexamer is colored according to B factors. (B) An example an omit map (S crystal, subunits A–F) showing ligand densities in the active sites of the NtrC1 hexamer that were used for placing nucleotides. See also Supplemental Figure S2. (C) Active site of subunit E showing modeled ADP-BeF3 ligand and its interaction with P-loop, arginine finger R299, and Walker B residues.
