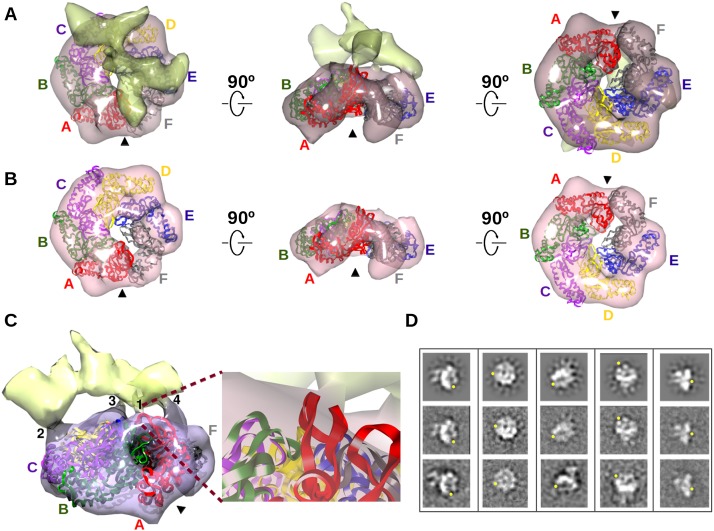
Figure 5.
Subunit A/F gap of the ATPase crystal structure persists in 3D EM reconstruction of a complex of ATPase, σ54, and promoter DNA. (A) 3D EM reconstruction of the complex of ATPase, σ54, and promoter DNA. Density for ATPase (pink) is distinguished from density for σ54 and promoter DNA. The hexamer crystal structure of the ATPase (colors as in Fig. 2) was fit to its EM density; the arrowhead points to the aligned gap in both structures. (B) EM density contoured at a threshold showing only the density corresponding to the ATPase. (C) Four points of contact between the ATPase and σ54 promoter DNA. Contact 1 is magnified to show the GAFTGA loop of subunit A (red ribbon) and σ54/promoter DNA. (D) Selected forward projections (top row) of the complex and averages of the corresponding aligned particles (middle row) are above similar looking reference-free class averages (bottom row); yellow dots locate the gap in the ATPase ring. See also Supplemental Figure S3 and the Supplemental Movies.

