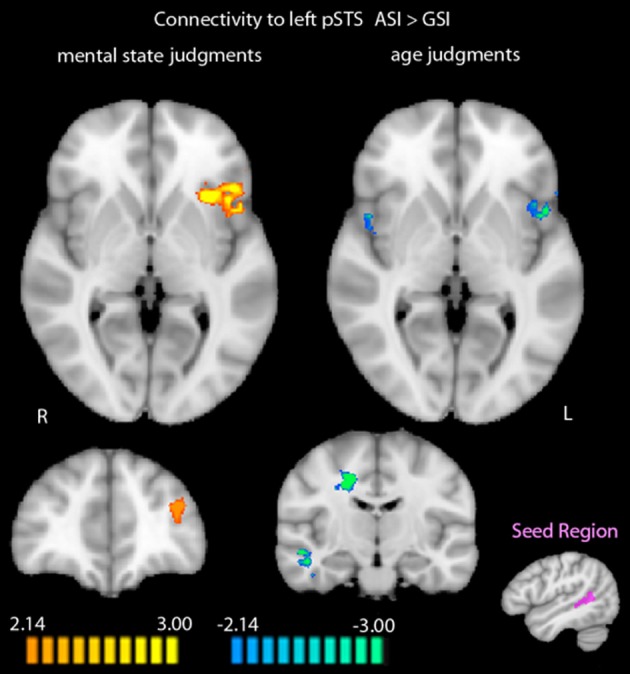
Figure 3.

Differential functional connectivity to the left posterior STS during mental state and age judgments after the ASI vs. the GSI. Regions in orange showed greater functional connectivity to the left posterior STS during judgments post-ASI. Regions in blue showed greater functional connectivity to the left posterior STS during judgments post-GSI (p < 0.05, k = 34). The seed region for the connectivity analysis (shown in purple) was defined by greater activation to mental state judgments compared with age judgments in the RMET-R at baseline. Data is interpolated to 1 mm3 resolution for presentation.
