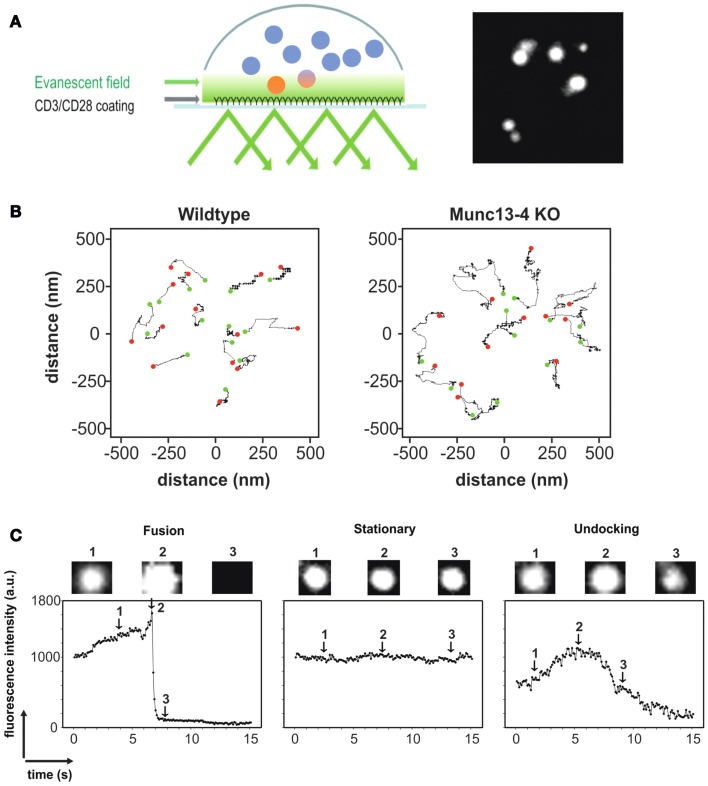
Figure 2.
(A) Left, cartoon depicting the methodology of TIRFM in CTLs using anti-CD3/anti-CD28 antibody-coated coverslips to mimic an IS. Only LGs that are within the evanescent field (close to the IS; see Text for details) are fluorescent. Right, TIRFM image of CTLs transfected with granzyme B-TFP to specifically label LGs. (B) Representative trajectories of vesicles from WT (left) and Munc13-4 KO (right) CTLs to display their mobility. The green dot represents the starting position of the LG and the red dot represents the end position of the LG. The absence of the priming factor Munc13-4 leads to a significant increase in vesicle mobility in TIRFM (28). (C) Fluorescence profile of a fusing LG (left), a stationary LG (middle), and an LG that is undocking (right) as seen in TIRFM. Acquisition frequency was 10 Hz. Granzyme B-TFP was used to label LGs.

