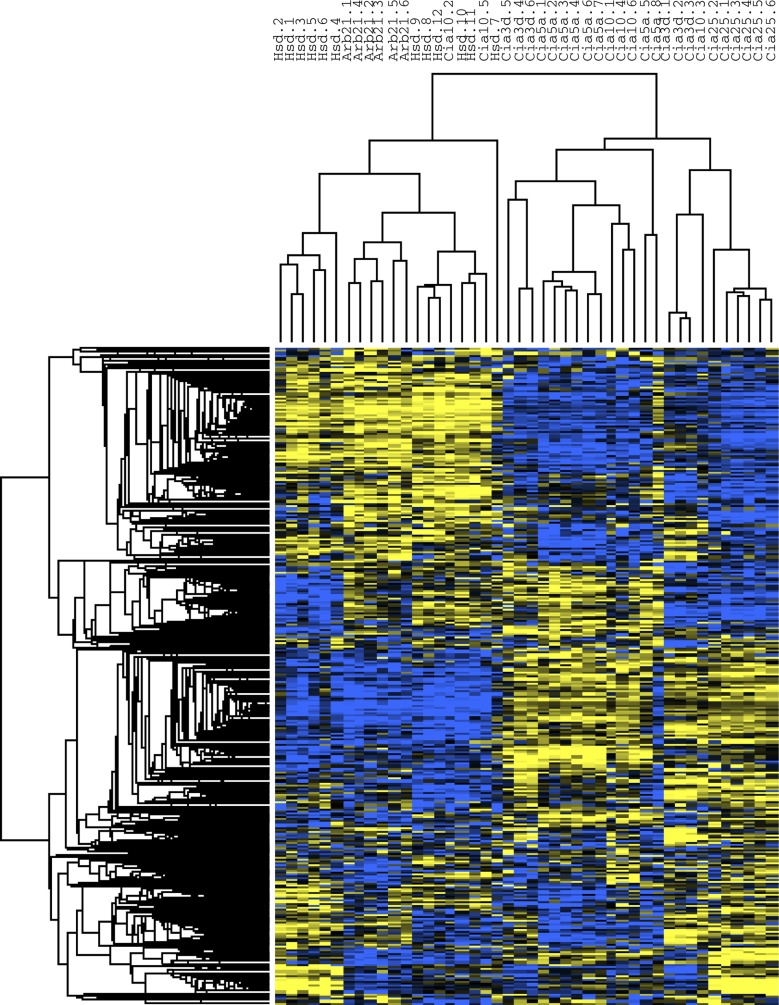
Fig. 3.
Cluster analysis heat map. DA/Arb and DA/Hsd cluster together, while most of the congenic and subcogenic protected rats clustered as a separate group. The heat map shows in graphical form the significant differences between DA and congenics. Yellow, increased expression; blue, decreased expression.

