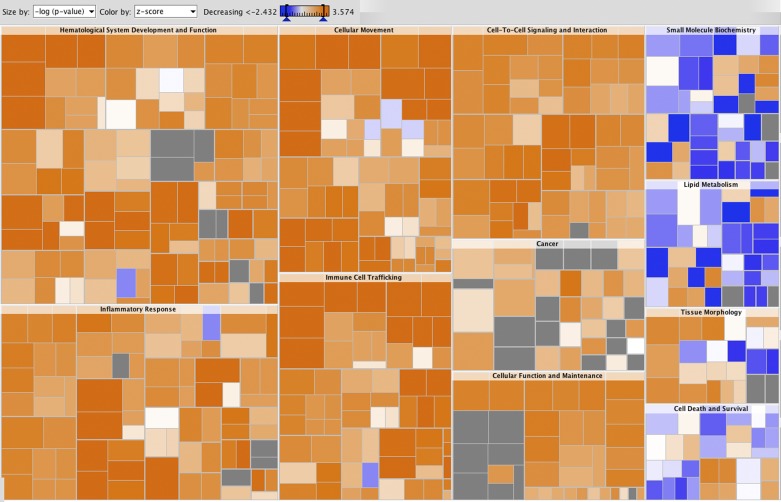
Fig. 5.
Heat map of biological functions activated in DA and in the congenic strains. Gene clusters suggesting biological functions to be activated in DA are marked in shades of orange and those to be activated in the congenics are marked in shades of blue. The square size in the figure is proportion to the −log(P value), and the colors represent z-scores. Color intensity refers to the z-score for enrichment of each functional subcategory. The highest z-scores were in the “cell movement” and “immune cell trafficking” (neutrophils, myeloid cells, phagocytes) and “inflammatory response.” The subcategory with the lowest z-score was “metabolism of triacylglycerol.”

