FIGURE 5.
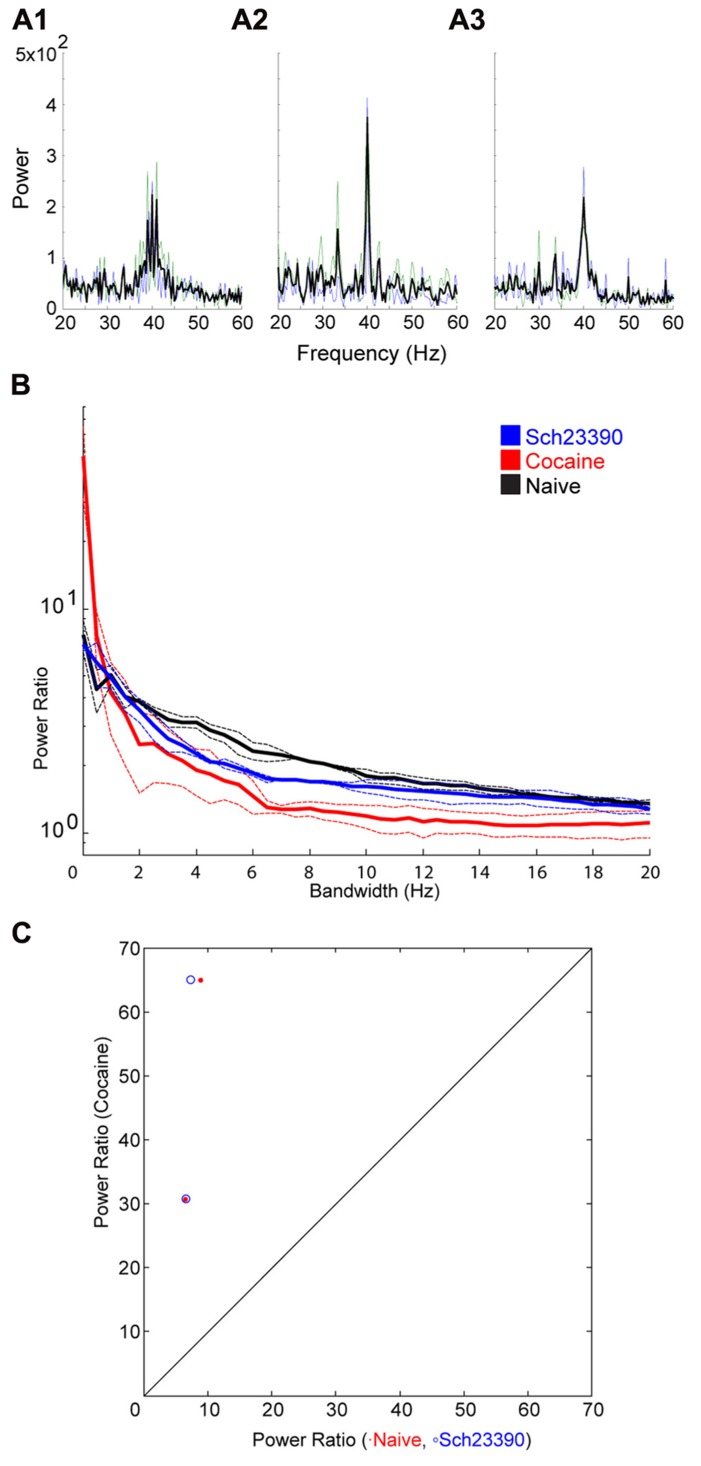
Effect of the D1 antagonist SCH23390 on the cocaine induced change to the induced oscillation. (A) Power spectra around the stimulated frequency in naïve (A1), cocaine (A2), and SCH23390 (A3) conditions. Sharpening of the peak is seen here again and appears to be reversed by SCH23390. (B) Power ratio vs. bandwidth plot reflecting the changes in peak power and bandwidth seen above. SCH23390 appears to block the sharpening effect of cocaine treatment. (C) Comparison of power ratio at the peak, across treatment conditions. Above the line represents a larger power ratio in cocaine treatment vs. either naïve (red) or SCH23390 (blue). Data points are nearly overlapping demonstrating that SCH23390 appears similar to the naïve condition.

