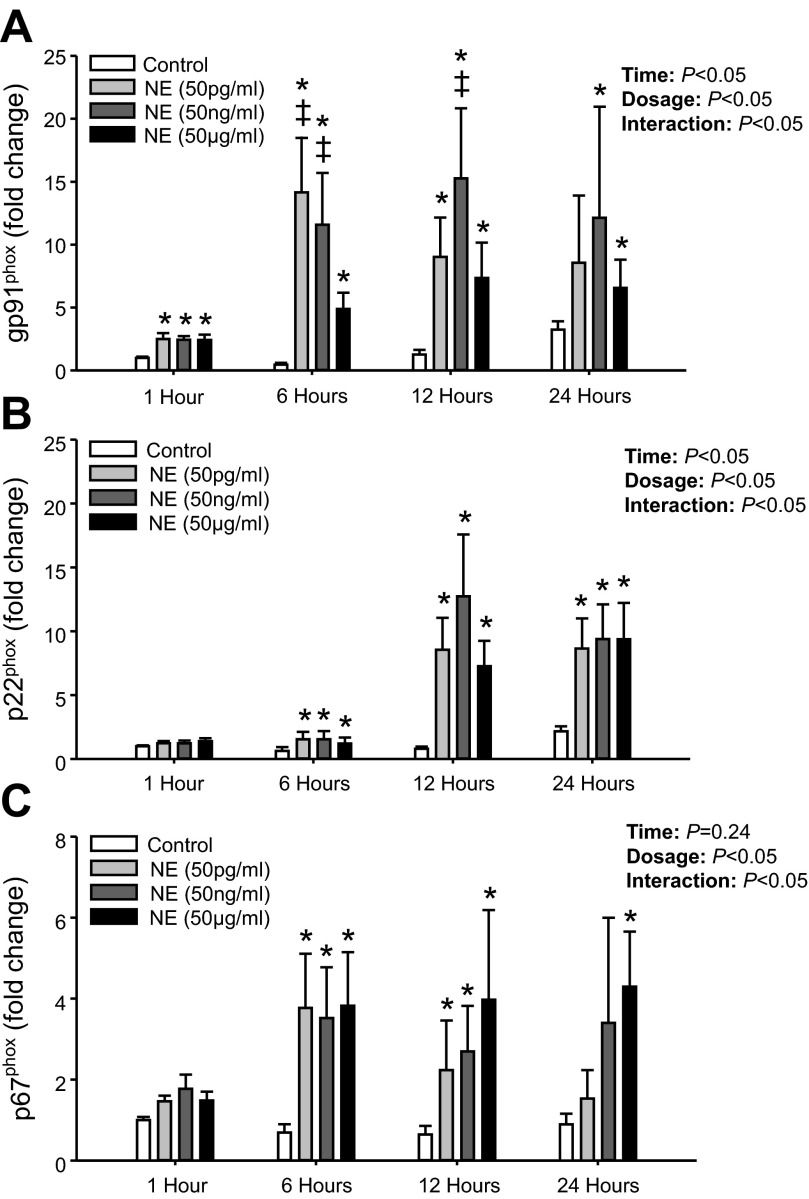
Fig. 3.
Mean data from study 1 showing mRNA levels for gp91phox (A), p22phox (B), and p67phox (C) at 1, 6, 12, and 24 h following NE (50 pg/ml, 50 ng/ml, and 50 μg/ml) treatment. Data are expressed as fold change from control treatment (PBS only) at 1 h. *Significant difference vs. Control (P < 0.05; within time point). ‡Significant difference vs. NE (50 μg/ml) (P < 0.05; within time point).

