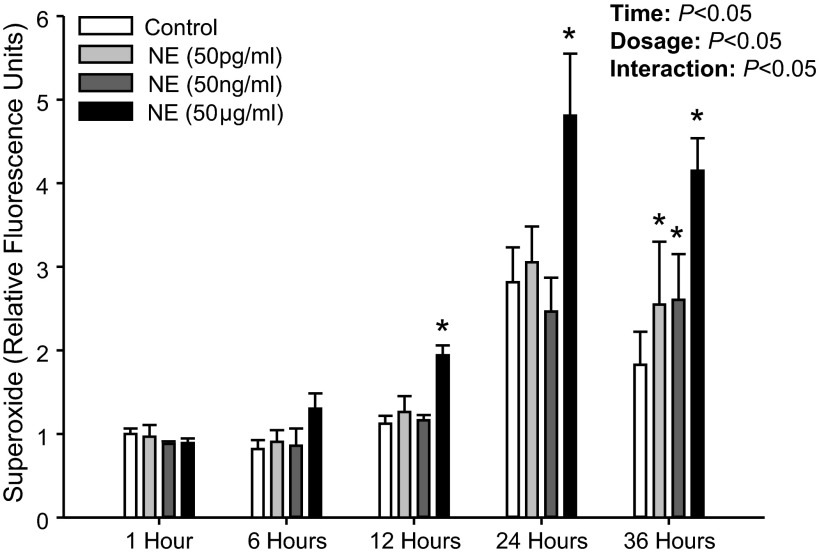
Fig. 4.
Mean data from study 1 showing intracellular superoxide production at 1, 6, 12, 24, and 36 h following NE (50 pg/ml, 50 ng/ml, and 50 μg/ml) treatment. Data are expressed as fold change from control treatment (PBS only) at 1 h. *Significant difference vs. Control (P < 0.05; within time point).

