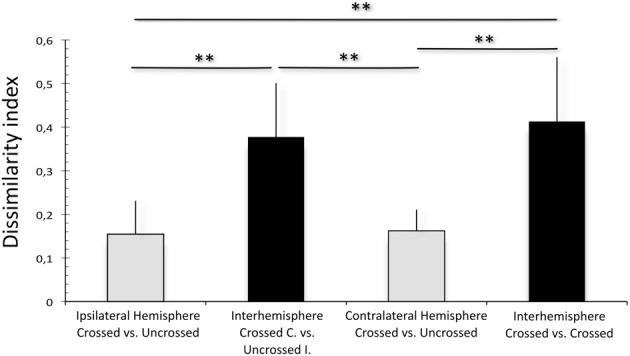
Figure 6.

Dissimilarity index computed between mean LFPs within one hemisphere (gray) and between hemispheres (black). Interhemisphere comparisons result in significantly higher dissimilarity index than within-hemisphere comparisons. Two-tailed Wilcoxon-Mann-Whitney test, **p < 0.01.
