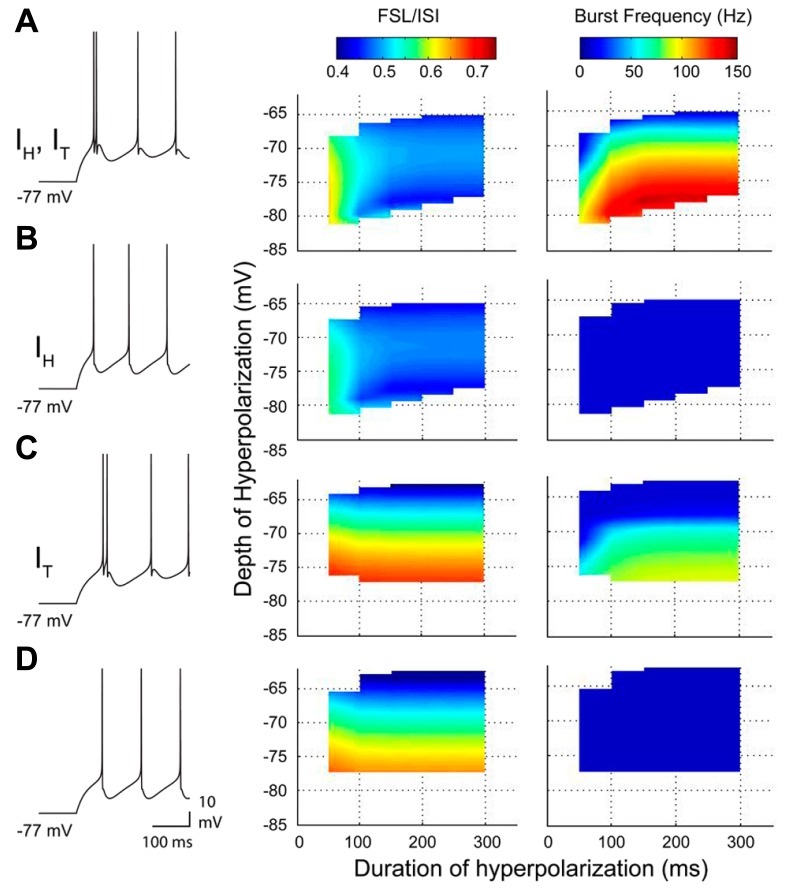
FIGURE 5.
A reduced model of the roles for IT and IH in rebound response frequency and FSL. (A–D), Output from a two compartment model containing combinations of IT and/or IH, with representative spike output following a 300 ms hyperpolarizing step to -77 mV from a resting potential of ~-60 mV (10 Hz baseline firing) (left). Changes in frequency and FSL/ISI are plotted in three dimensions in relation to the frequency and ISI present at a resting membrane potential of ~-60 mV. Note a decrease in FSL/ISI and increase in frequency with longer durations or larger amplitude hyperpolarizations when both IT and IH are present (A). Removing IT dramatically abolishes all rebound responses (B), while removing IH reverses the FSL/ISI relationship and reduces rebound frequency (C). Removing both IT and IH blocks the shifts in both FSL/ISI and spike frequency found when both are present (D).

