
Fig. 1.
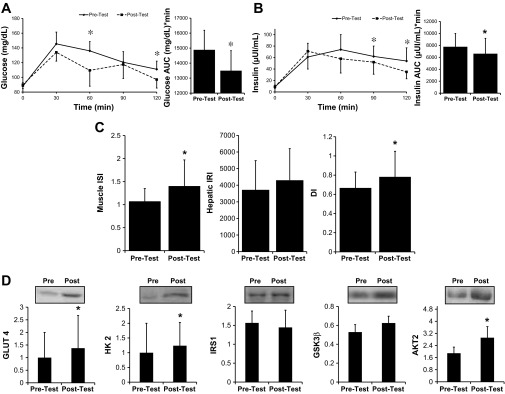
Effects of resistance training (RT) on (A) glucose and (B) insulin levels during a 2-h oral glucose tolerance test. Data indicate significant reductions in time points—60 and 120 min for glucose and 90 and 120 min for insulin (n = 26). Bar graphs illustrate total glucose area under the curve (AUC) and insulin AUC, pre- and postintervention, for their respective curves. Data are presented as median and median absolute deviation (MAD). *P < 0.01. C: changes in muscle insulin sensitivity index (ISI), hepatic insulin resistance index (IRI), and oral disposition index (DI; *P < 0.05). D: effects of RT on protein content of glucose transporter type 4 (GLUT4), hexokinase 2 (HK2), insulin receptor substrate 1 (IRS1), glycogen synthase kinase 3β (GSK3β), and RAC-β serine/threonine-protein kinase (AKT2; *P < 0.02). Bar graphs present median and MAD for pre- and postintervention tests.