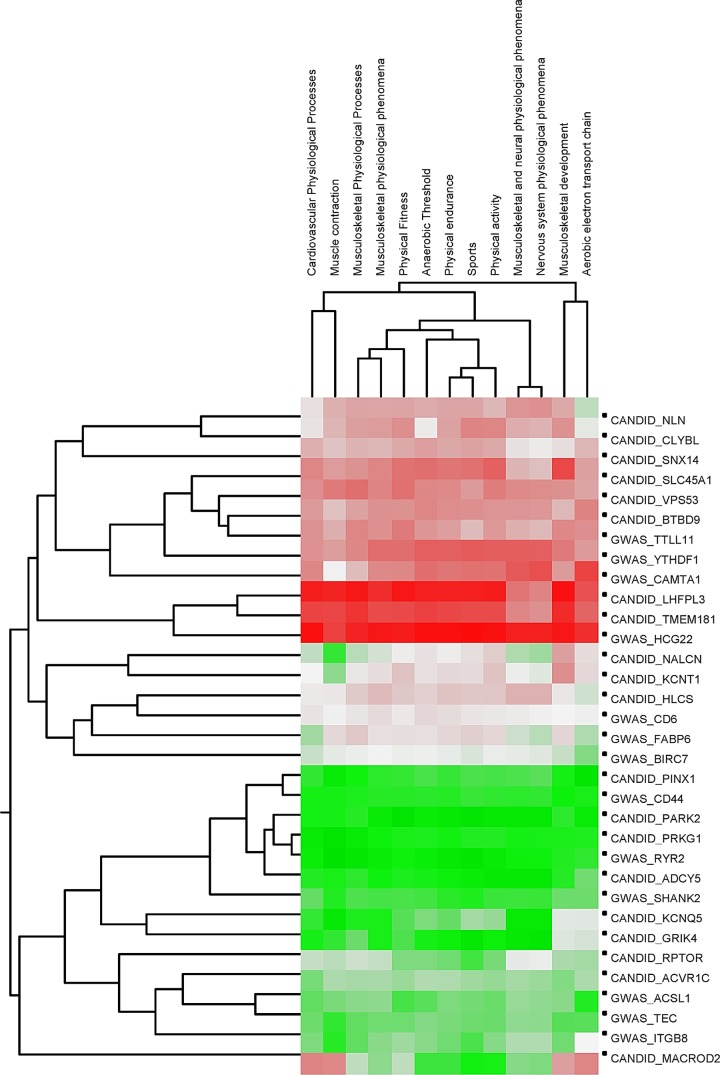
Fig. 2.
Application of Biograph software to formulate hypotheses on mechanisms connecting candidate genes to candidate physiological processes. Two-way hierarchical clustering of targets (query genes) and source concepts (key words). Genes are shown in rows and key words in columns. Clustering was performed on the proximity score for every gene to each source concept, as described in the text. Proximity score is represented on a green-white-red color scale with green representing greater proximity and red depicting lower proximity.

