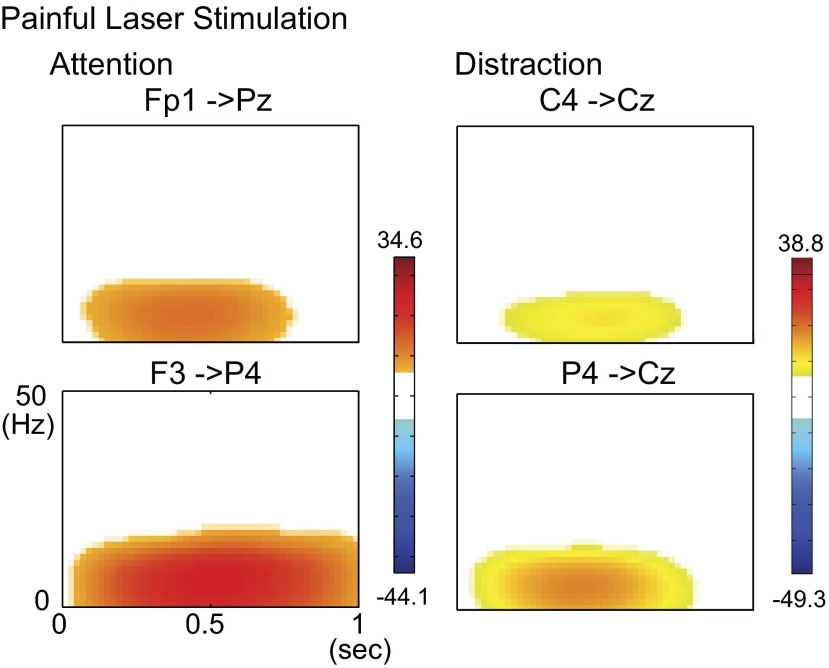
Fig. 2.
Examples of time-frequency plots of event-related causality (ERC) for different pairs of electrodes with the painful laser stimulus. Both displays are shown under the laser attention and laser distraction conditions with respect to the laser, as labeled. In the ERC time-frequency plots hot colors indicate significant increases in the raw ERC value. On the color scale, numbers indicate maximum and minimum values of ERC. All colored pixels indicate a significant change in ERC, and the maximum ERC indicates the highest strength of directed interaction for the pair of channels.

