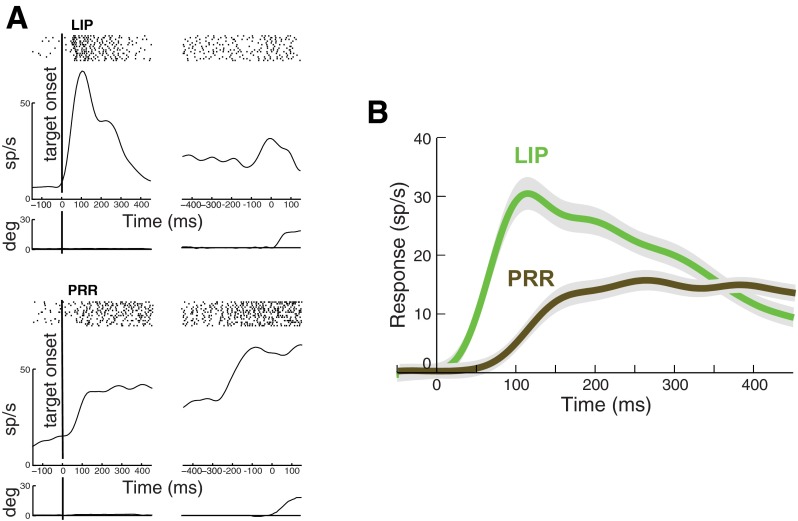
Fig. 2.
Responses of lateral intraparietal area (LIP) and parietal reach region (PRR) neurons in the visually guided task. A: responses of an LIP and a PRR neuron. Shown are mean responses in the first 15 trials in which the animal makes a saccade (LIP) or a reach (PRR) into the neuron RF. Activity is aligned to the onset of the target (left) and to movement onset (right). Top: raster plot indicates the times of the cell discharge during each trial. Bottom: average eye (LIP) and arm (PRR) position traces. B: response of the LIP and PRR neuronal populations. All trials from each neuron in which the animal makes a saccade (LIP) or a reach (PRR) into the RF are included. Time course of the averaged responses in LIP (green, n = 60 cells) and PRR (brown, n = 65 cells) are given. Activity is aligned to target onset. Peristimulus time histogram was smoothed with a low-pass filter (see materials and methods). Responses are plotted relative to a baseline in the interval from 50 ms preceding target onset to 20 ms following target onset (see materials and methods).

