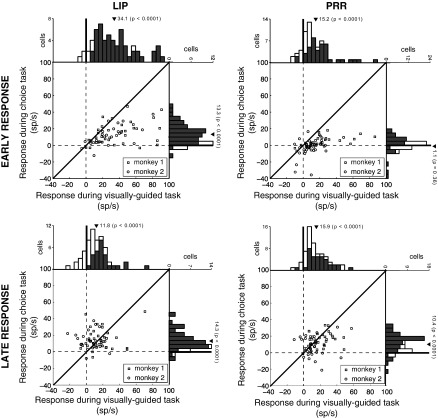
Fig. 7.
Comparison of responses of LIP and PRR neurons in the visually guided and the choice tasks. All trials from each neuron in which the animal makes a saccade (LIP) or a reach (PRR) into the RF are included. Plots give the response of each LIP (left) and PRR (right) cell in the interval from 100 to 200 ms after target onset (early response, top), and 400 to 500 ms after target onset (late response, bottom), relative to the baseline. Histograms quantify the number of cells in each bin of response magnitude. Dark triangle gives the mean. P value is the outcome of the associated two-tailed t-test. While LIP neurons show substantial early responses in both the visually guided and choice tasks, PRR neurons show early responses only in the visually guided task. In the choice task, the early response in PRR is absent. As a control, PRR neurons exhibit a robust response in the choice task in the late period (bottom).

