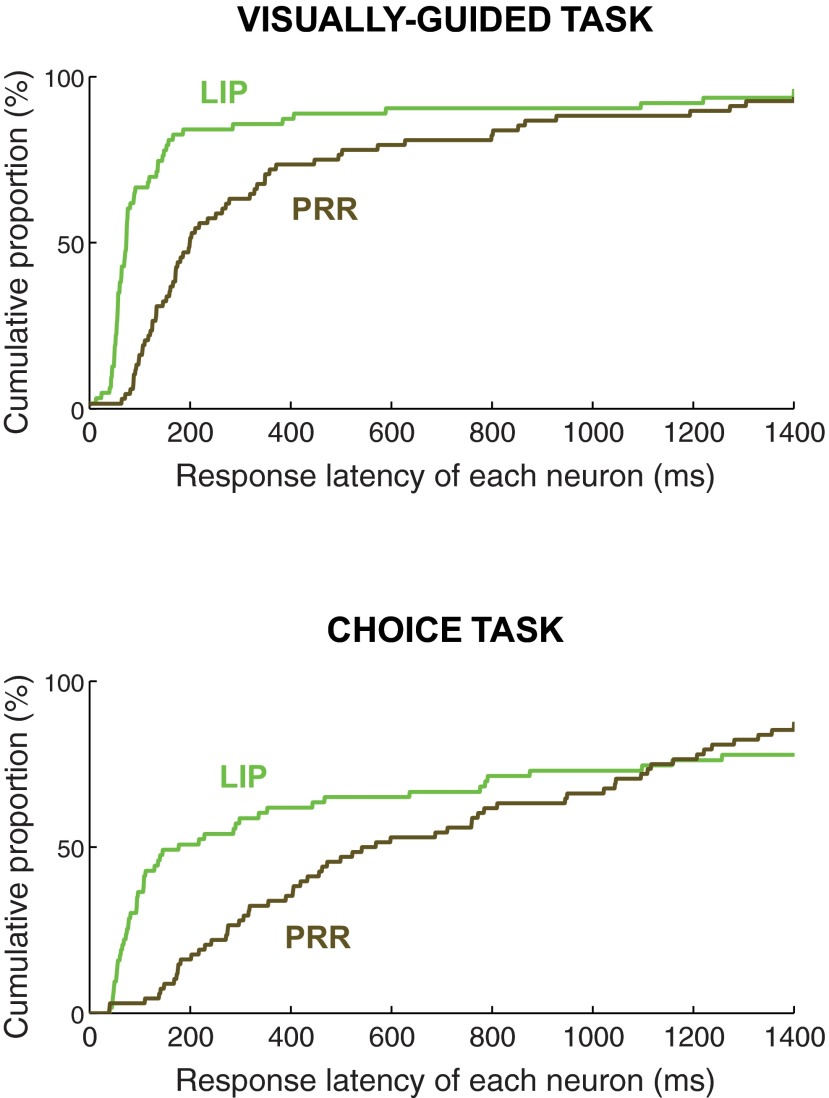
Fig. 8.
Latency of neuronal responses to target onset. The curves give the cumulative distribution of the response latency of each neuron (60 neurons in LIP and 65 neurons in PRR) relatively to target onset (time 0). The analysis includes all saccades into RF (LIP) and all reaches into RF (PRR). Data are displayed separately for LIP neurons (green traces) and PRR neurons (brown traces), for the visually guided task (top) and the choice task (bottom). This analysis reveals that PRR neurons have substantially longer response latencies compared with LIP neurons. The effect is particularly pronounced in the choice task (bottom). Not all neurons show a significant response relative to the baseline and so the cumulative traces fall short of the 100% of neurons.

