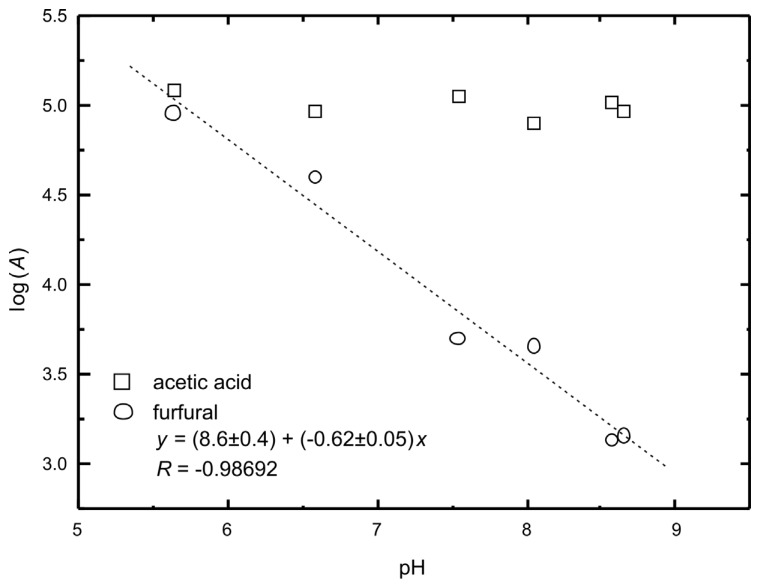
Figure 3.
Comparison of chromatographic peak areas for acetic acid and furfural emitted by cellulosic samples (Whatman filter paper no.1) impregnated with different phosphate buffers after an 18-h annealing period in a glass vial and equilibrium pH of the same samples. Conditions of extraction using SPME fibre: 40 °C, 1 h. Typical relative standard deviation in determination of log(A) was <5%.

