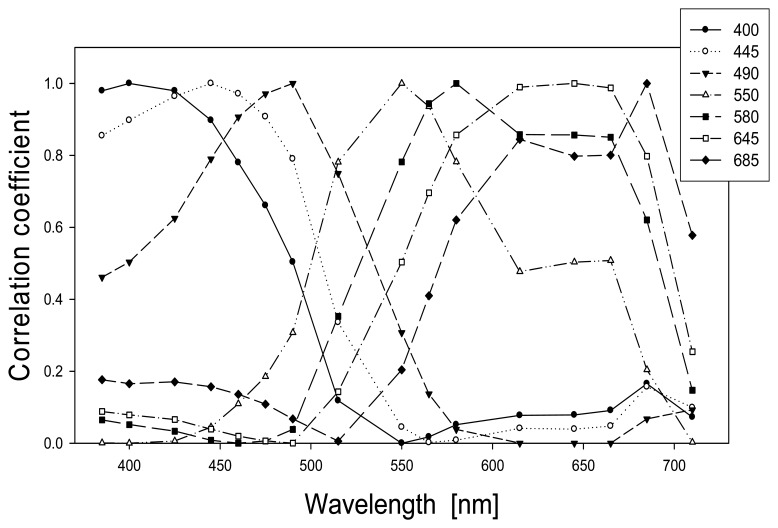
Figure 6.
Spectral distributions of correlation coefficients of Rrs(λ) at the bands (see Fig. 5) selected from first- and second-order derivative analyses (see text for details). The bands in the insert indicate the Rrs at those bands was used as the independent variable, respectively, while Rrs at other bands were considered as the dependent variable, a correlation coefficient for linear regression was then obtained for each Rrs pair.

