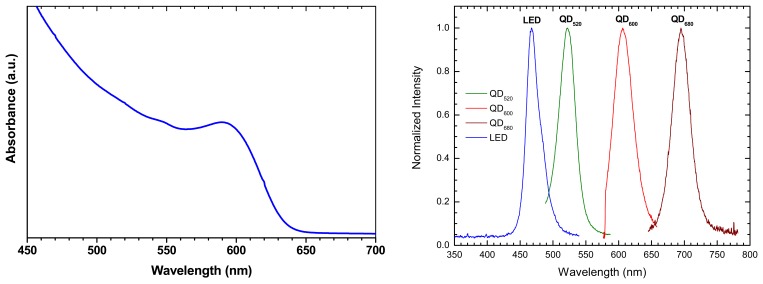
Figure 1.
Left –Typical absorption spectrum of CdSe nanocrystal QDs. Right - Normalized emission spectra of different samples of core-shell QDs immobilized in a sol-gel matrix. Peak emissions from blue to red are 520nm (CdSe/ZnS), 610nm (CdSe/ZnS) and 680nm (CdTe/ZnS). The spectrum of the excitation source, a blue LED (470nm), is also shown.

