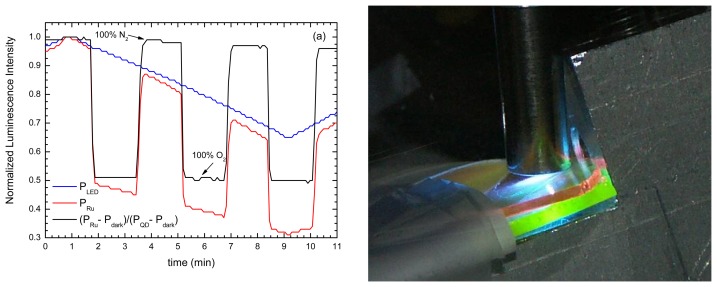
Figure 11.
a) Sensor response to O2/N2 saturation cycles while excitation optical power was slowly changed from 100% to 70%. Both the raw luminescent output signal of Ru(bpy), and the ratiometric signal obtained using the QDs luminescence are shown. b) a picture of the luminescent QD and oxygen sensing samples excited using a fiber bundle.

