
Figure 7. GM-CSF triggers Zn binding to MTs in vivo and in human macrophages.
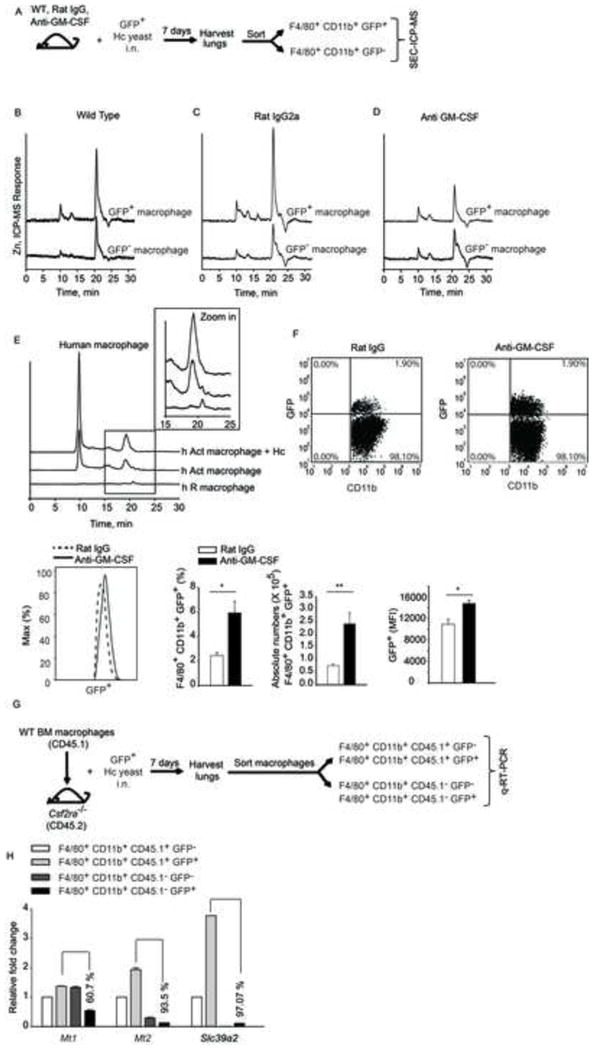
(A) Schematic, mice were left untreated or treated with rat IgG or anti-GM-CSF and infected i.n. with 2 × 10⁶ GFP+ yeasts (Hc); lungs were harvested 7 days p.i. and F4/80+CD11b+GFP+ and F4/80+CD11b+GFP− cells were sorted. SEC-ICP-MS profiles of (B) F4/80+CD11b+GFP+ and F4/80+ CD11b+GFP− cells isolated from lungs; (C) rat IgG treated and (D) anti-GM-CSF treated mice, 2 independent experiments; (E) SEC-ICP-MS profiles of lysates from human resting (h R) and GM-CSF activated (h Act) macrophages; Y axis, offset Zn signal; inset, zoom in of 15–25 min fraction, 2 independent experiments; (F) Dot plot of lung leukocytes gated on F4/80+CD11b+ macrophages; histogram of F4/80+CD11b+GFP+ macrophages; bar graphs are quantification of %, absolute numbers and MFI of F4/80+CD11b+GFP+ macrophages in rat IgG vs anti-GM-CSF treated mice, data are mean ± SEM, n=4; (G) Schematic representing transfer of CD45.1 WT macrophages into CD45.2 Csf2ra−/− mice, infection and sorting of WT vs Csf2ra−/− macrophages from lungs for gene expression analysis; (H) qRT-PCR of Mt1, Mt2 and Slc39a2 from sorted CD45.1+ (WT) and CD45.1− (Csf2ra−/−) GFP− and GFP+ macrophages normalized to CD45.1+GFP− macrophages, % values are decrease in gene expression in Csf2ra−/− CD45.1− GFP+ macrophages compared to WT CD45.1+ GFP+ macrophages, data are mean ± SEM, data are from 1 experiment. Related to Figure S6.