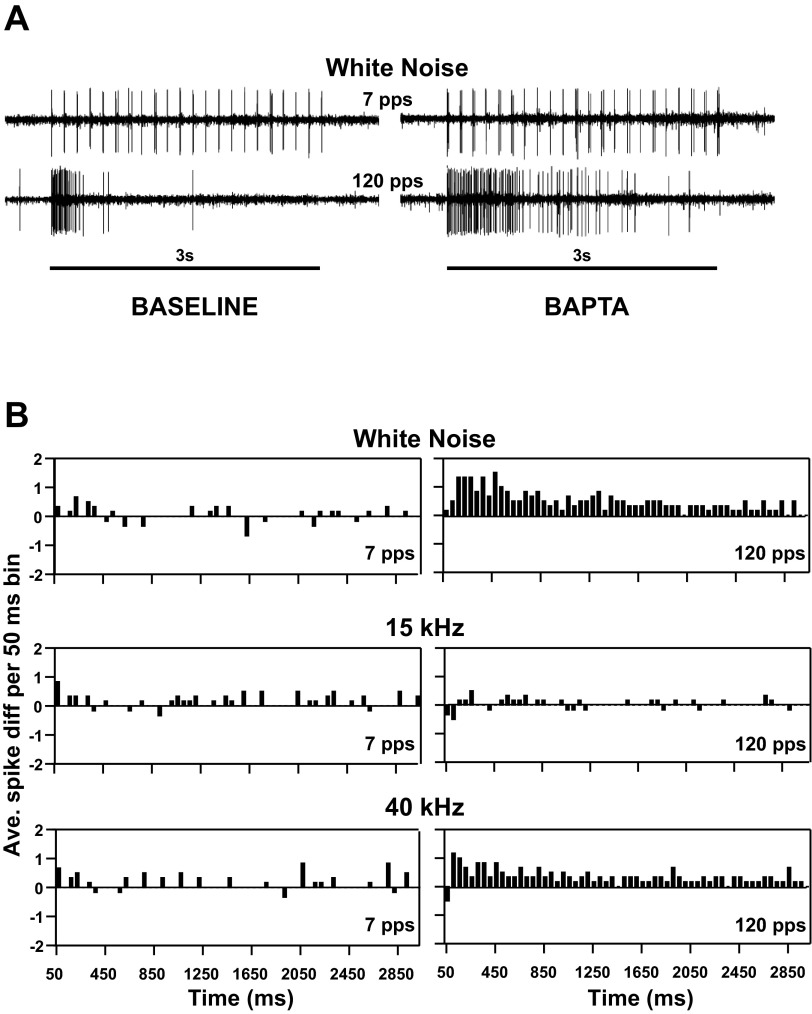
Fig. 3.
TN-1 responses before and after BAPTA injection. A: extracellular recordings of TN-1 responses to 3.5-ms WN acoustic pulses presented at 7 and 120 pps before (Baseline, left) and after (BAPTA, right) BAPTA injection (3-s stimulus duration). B: histograms of the change of TN-1 spiking after BAPTA injection (mean, n = 6): acoustic stimulation with WN pulses (3.5-ms duration; top), 15 kHz (middle), and 40 kHz (bottom) repeated at 7 (left) and 120 (right) pps. Bins were 50 ms wide. Positive values indicate an increase in TN-1 responses after BAPTA injection.

