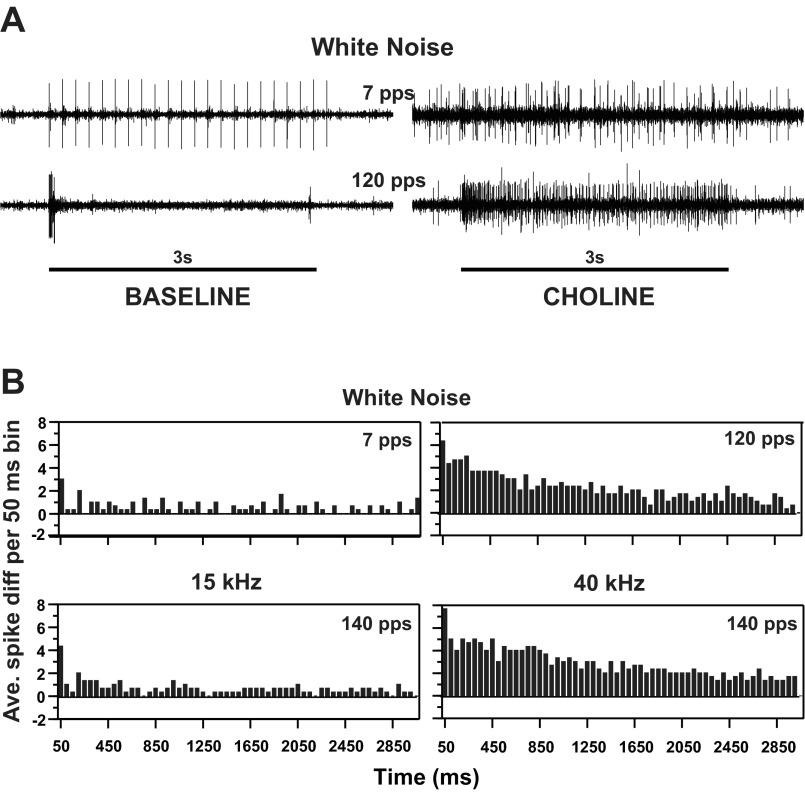
Fig. 5.
TN-1 responses before and after application of low-Na+ saline replacing NaCl with choline chloride. A: extracellular recordings of TN-1 responses to 3.5-ms WN acoustic pulses presented at 7 and 120 pps (3-s stimulus duration) before (Baseline, left) and after (Choline, right) application of low-Na+ saline. B: histograms of the change of TN-1 spiking after introduction of low-Na+ saline (mean, n = 3): acoustic stimulation with WN pulses (3.5-ms duration) presented at 7 and 120 pps (top), 15 kHz at 140 pps (bottom left), and 40 kHz at 140 pps (bottom right). Bins were 50 ms wide. Positive values indicate an increase in TN-1 responses after introduction of low-Na+ saline.

