Fig. 3.
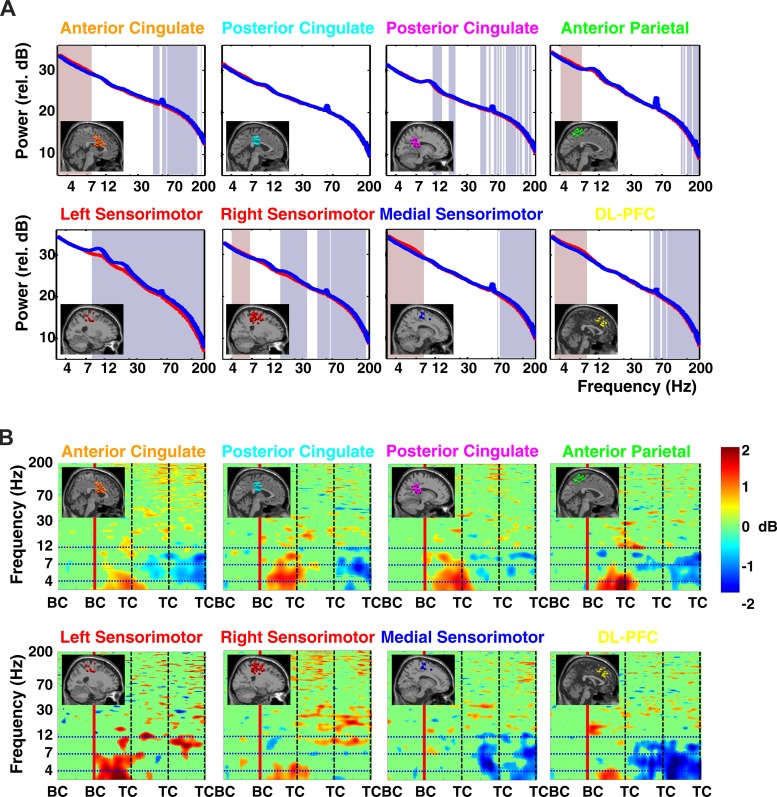
A: grand average spectral power for each cluster of electrocortical sources during walking on the balance beam (red line) and walking on the treadmill belt (off the balance beam; blue line). The lowest frequency shown is 3 Hz. Significant differences in spectral power between the on-beam and off-beam conditions are indicated by the shaded regions: reddish (theta band) regions indicate larger power in balance beam walking; bluish regions (higher frequencies) indicate larger power in treadmill walking (P < 0.05). The colors of the plot titles correspond to the colors of the equivalent current dipoles in Fig. 2. DL-PFC, superior dorsolateral-prefrontal cortex. B: grand average normalized log spectrograms showing changes in spectral power during and after loss of balance relative to average spectral power during the last successful step prior to loss of balance (left of red vertical line). Mean step period (time between successive foot-to-ground contacts) was 1,100 ms. Four steps are shown; BC indicates foot-to-beam contact, and TC indicates foot-to-treadmill contact. After the second BC event, the subject loses balance and recovers by stepping off of the beam and onto the treadmill. Nonsignificant differences from baseline (P > 0.05) have been set to 0 dB (green). The colors of the plot titles correspond to the colors of the equivalent current dipoles and dipole clusters in Fig. 2. The left sensorimotor cluster plot averages only those trials in which a loss of balance occurred toward the right side of the beam; the right sensorimotor cluster plot averages only those trials in which a loss of balance occurred toward the left side of the beam. All other results shown here average all trials when a loss of balance occurred, both to the left and to the right. Theta spectral power increases began in the left sensorimotor sources, followed by the posterior cingulate, anterior cingulate, and right sensorimotor sources, and finally in anterior parietal and superior dorsolateral-prefrontal sources.

