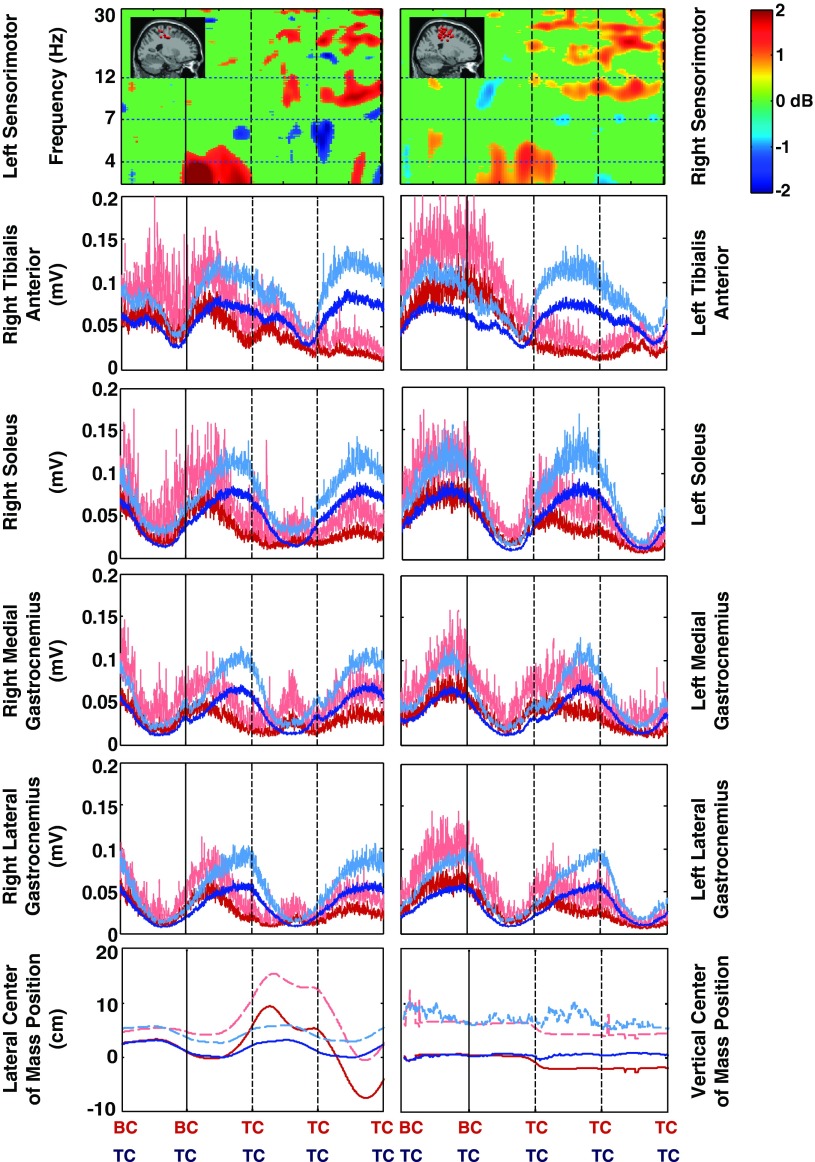
Fig. 4.
Timing comparison of mean sensorimotor source cluster changes in EEG spectral power, lower leg electromyography (EMG), and center of mass motion for losses of balance to the left side of the beam. Four steps are shown. After the second BC (black vertical line), the subject loses balance and recovers by stepping off of the beam and onto the treadmill. For the sensorimotor cluster EEG spectral changes, nonsignificant differences from baseline (P > 0.05) have been set to 0 dB (green); the lowest frequency shown is 3 Hz. For the lower limb EMG and center of mass position data, red lines show loss-of-balance trial averages, blue lines are on-beam walking averages, and dashed lines indicate +1 standard deviation. The cluster dipole images are replicated from Fig. 3.

