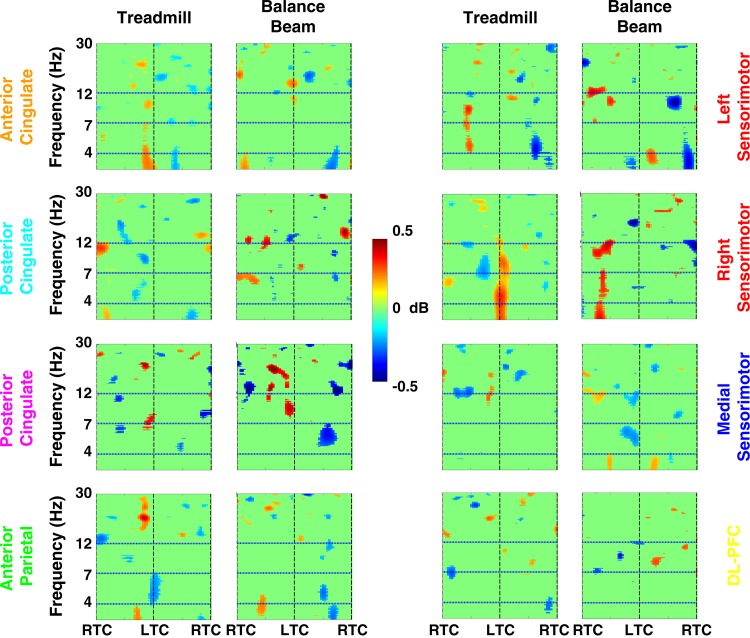
Fig. 6.
Grand average normalized log spectrograms during walking off and on the balance beam (Treadmill and Balance Beam, respectively). Two steps are shown, with RTC indicating right foot-to-treadmill contact and LTC indicating left foot-to-treadmill contact. Mean step period was 1,100 ms. Nonsignificant differences from baseline (P > 0.05) have been set to 0 dB (green). The colors of the plot titles correspond to the colors of the equivalent current dipoles and dipole clusters in Fig. 2. There were no substantial changes in theta spectral power during treadmill walking or balance beam walking compared with those seen during loss of balance on the balance beam (Figs. 3–5).

