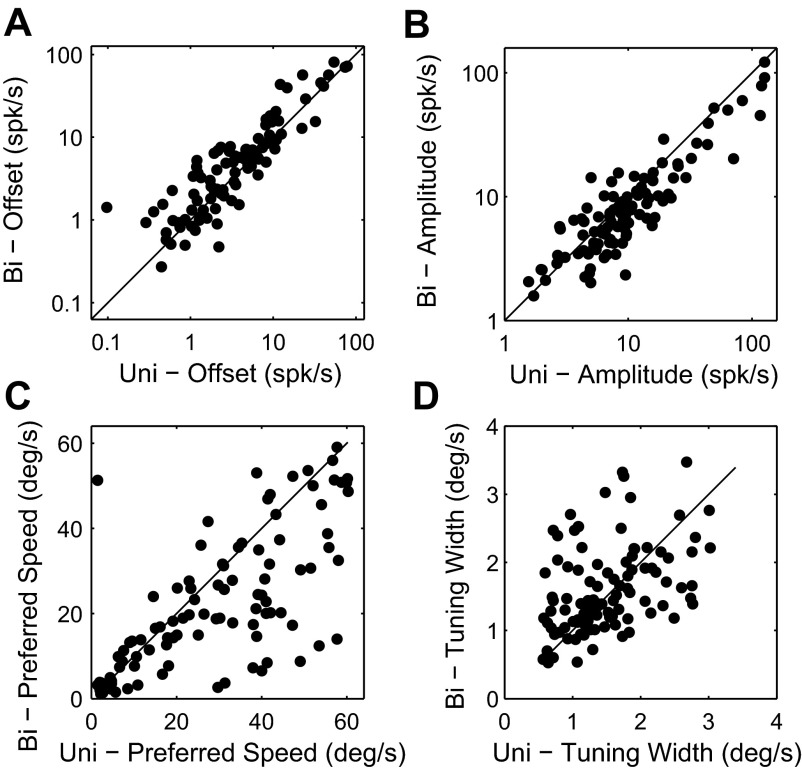
Fig. 4.
Cell-by-cell comparison of tuning parameters. This plot contains only significantly tuned cells (n = 103). A: comparison of the speed-independent (i.e., untuned) response for bidirectional stimuli vs. unidirectional stimuli moving in the preferred direction (offset parameter: α in Eq. 1). B: comparison of the tuning amplitude (β). C: comparison of the preferred speed (δ). D: comparison of the speed tuning width (σ). This figure shows that when a bidirectional stimulus was shown MT neurons typically responded more to all speeds (A) but with a reduced amplitude (B). In addition, most cells preferred lower speeds in bidirectional motion patterns (C).

