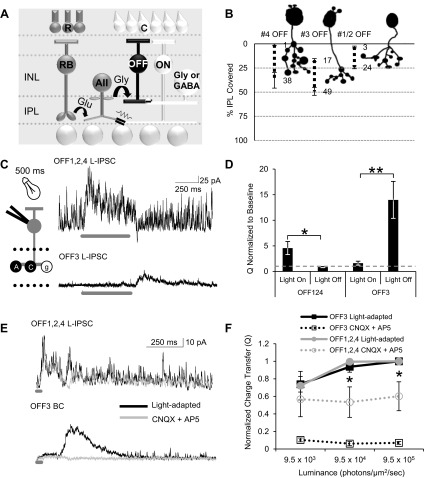
Fig. 1.
Inhibition to OFF bipolar cells in the dark-adapted retina. A: schematic of the rod pathway circuitry. Rod photoreceptors (R) activated by dim light release glutamate (Glu) onto rod bipolar cells (RB), which release glutamate onto AII amacrine cells (ACs). AII ACs release glycine onto OFF cone bipolar cells (OFF BCs) while transmitting the depolarizing signal to ON cone bipolar cells (ON BCs) via gap junctions. Cone photoreceptors (C) are activated by brighter light and release glutamate onto OFF and ON BCs. Activation of these BCs in turn releases glutamate onto other GABAergic (GABA) and glycinergic (Gly) ACs, which also have inputs onto OFF BCs. Additionally, activation of ON BCs can depolarize AII ACs through electrical gap junctions. INL, inner nuclear layer; IPL, inner plexiform layer. B: example cell morphology traces of type 4, 3, and 1/2 OFF BCs. Type 4 OFF BCs have terminals that ramify in 1–38% (n = 4) of the IPL, type 3 OFF BCs have terminals that ramify in 17–50% (n = 11) of the IPL, and type 1/2 OFF BCs have terminals that ramify in 1–16% of the IPL (n = 9). Type 1 and 2 OFF BCs are difficult to differentiate morphologically and so have been pooled. C: example light-evoked inhibitory postsynaptic currents (L-IPSCs) recorded from an OFF4 BC (representing the OFF1,2,4 group that we have pooled together) and an OFF3 BC to a 500-ms stimulus (dark gray bar). OFF1,2,4 BCs show an inhibitory response with the onset of light, while OFF3 BCs show an inhibitory response with the offset of light. Recording paradigm is shown on left (A, GABAA receptor; C, GABAC receptor; g, glycine receptor). D: OFF1,2,4 (n = 12) BCs have a significantly higher charge transfer (Q) during light onset, while OFF3 (n = 10) BCs have significantly higher charge transfer during light offset. Dashed gray line represents the normalized baseline responses. OFF1,2,4 during light offset and OFF3 during light onset were not different from baseline (P > 0.05). E: example L-IPSCs recorded from an OFF4 and a OFF3 BC to a 30-ms stimulus (dark gray bar) in the light and with the application of CNQX and AP-5. L-IPSCs remained in OFF1,2,4 BCs but were abolished in OFF3 BCs with CNQX and AP-5. F: intensity response curves of charge transfer normalized to the max light-adapted L-IPSC in OFF1,2,4 (n = 4) and OFF3 (n = 5) light-adapted BCs. CNQX and AP-5 significantly reduced OFF1,2,4 L-IPSCs at the brighter light intensities but abolished OFF3 BC L-IPSCs at all light intensities. *P < 0.05, **P < 0.01.

