Fig. 6.
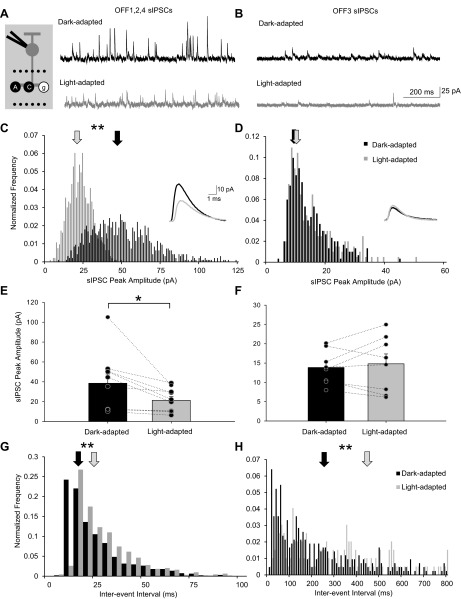
Light adaptation decreased sIPSC peak amplitude and frequency in OFF1,2,4 BCs but only frequency in OFF3 BCs. A and B: example traces showing the sIPSCs from an OFF1/2 and an OFF3 BC, respectively, in dark-adapted and light-adapted conditions. Recording paradigm is shown on left. The sIPSC peak amplitude histogram distributions (normalized to number of events) of the OFF1,2,4 and OFF3 BCs are shown in C and D, respectively. Light adaptation significantly reduced the sIPSC amplitude for OFF1,2,4 BCs (K-S P < 0.01) but not OFF3 BCs (K-S P > 0.05). Arrows show the average peak amplitude of the sIPSCs. Insets are averages of dark-adapted (black line) and light-adapted (gray line) sIPSCs; scale bars apply to both insets. E and F: the peak amplitude of sIPSCs was significantly decreased in OFF1,2,4 BCs (E, n = 10) after light adaptation and did not change in OFF3 BCs (F, n = 8). G and H: sEPSC interevent interval histogram distributions (normalized to number of events) of the OFF1/2 and OFF3 BCs seen in A and B, respectively. Each pair of data points in E and F shows the change in the response of a single BC. Light adaptation significantly increased the sIPSC interevent interval for both cell groups (K-S P < 0.01). Arrows show the average interval between the sIPSCs. *P < 0.05, **P < 0.01.

